Landing pages are essential lead generation and sales tools for marketers and business owners. Making your landing page live, however, is only the first step towards seeing these benefits. To know that your landing pages are actually successful you must look to landing page conversion benchmarks.
This guide highlights landing page statistics that will help you to improve conversions on your landing page, and achieve your business goals.
General Landing Page Statistics and Benchmarks
Before you start planning your landing page optimization strategy, it’s important to look at landing page conversion statistics. When you know the benchmarks, you can understand whether your landing pages are underperforming or exceeding expectations; and you’ll know which landing page best practices work for your audience.
Landing Page Conversion Benchmarks
Here are some general benchmarks for landing pages to get you started:
- The average conversion rate for landing pages is 9.7% (Unbounce)
- 90% of visitors who read your headline will also read your call-to-action (CTA) (TechJury/MarketingSherpa)
- Companies that increase their number of landing pages from 10 to 15 see a 55% increase in leads (Hubspot)
- 48% of landing pages include more than one offer (Marketing Experiments)
- Companies with 31 to 40 landing pages get seven times more leads than those with one to five landing pages (Hubspot)
- Landing pages have, on average, 11 form fields (PageWiz)
- Companies with more than 40 landing pages get 12 times more leads than those with 15 landing pages (Hubspot)
- 86% of the top landing pages are mobile-optimized (Nifty Marketing)
- 48% of marketers build a new landing page for each new campaign (Marketing Experiments)
- 52% of marketers reuse landing pages for their campaigns (Marketing Experiments)
Landing Page Conversion Rate Optimization (CRO) Statistics
The following landing page conversion rate statistics will fuel ideas for your landing pages:
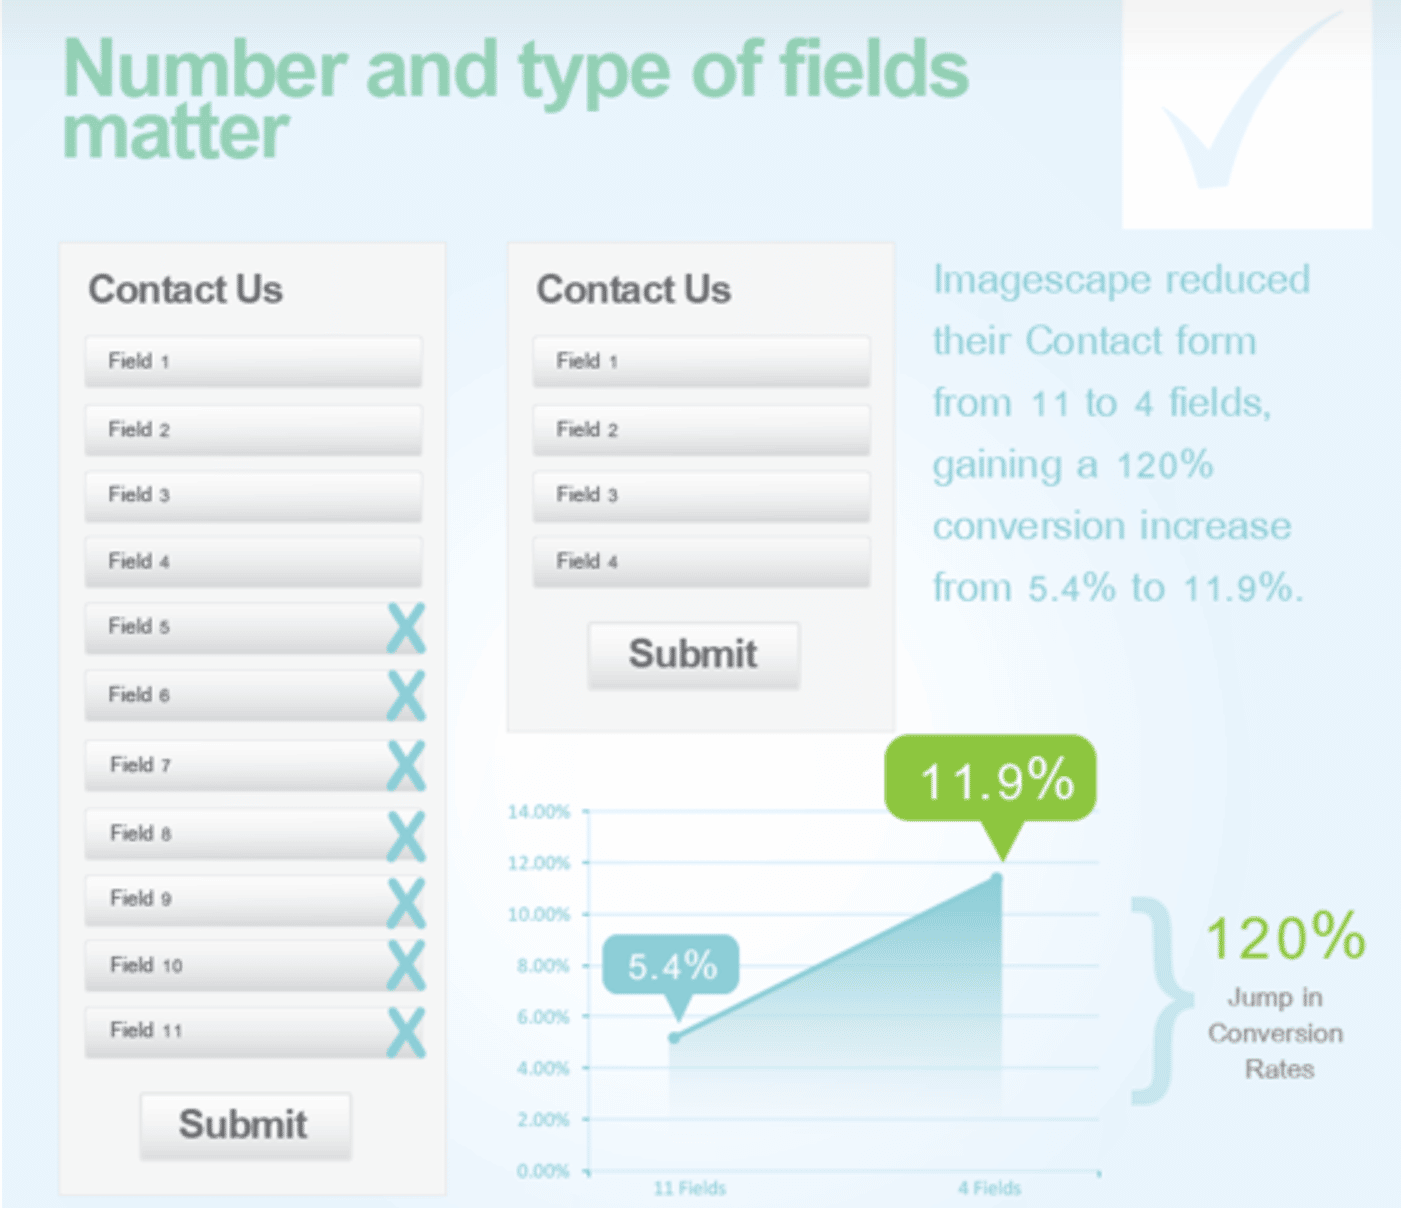
Image source: Unbounce
- Reducing landing page form fields to just four, boosts conversions by 120% (Unbounce)
- Requesting age reduces conversion rates (Hubspot)
- Putting multiple offers on your landing page can reduce conversions by 266% (TechJury/bluleadz)
- Conversion rates drop by 4.42% for every extra second of page-load time (Portent)
- Landing page sign-up forms have a 23% conversion rate (Omnisend)
- 25% of online shoppers land on product-detail pages (Marketing Charts)
- Visitors who land on product-detail pages generate half the revenue of those landing on other pages (Marketing Charts)
Landing Page Optimization Statistics
These landing page stats should give you a head start on landing page optimization:
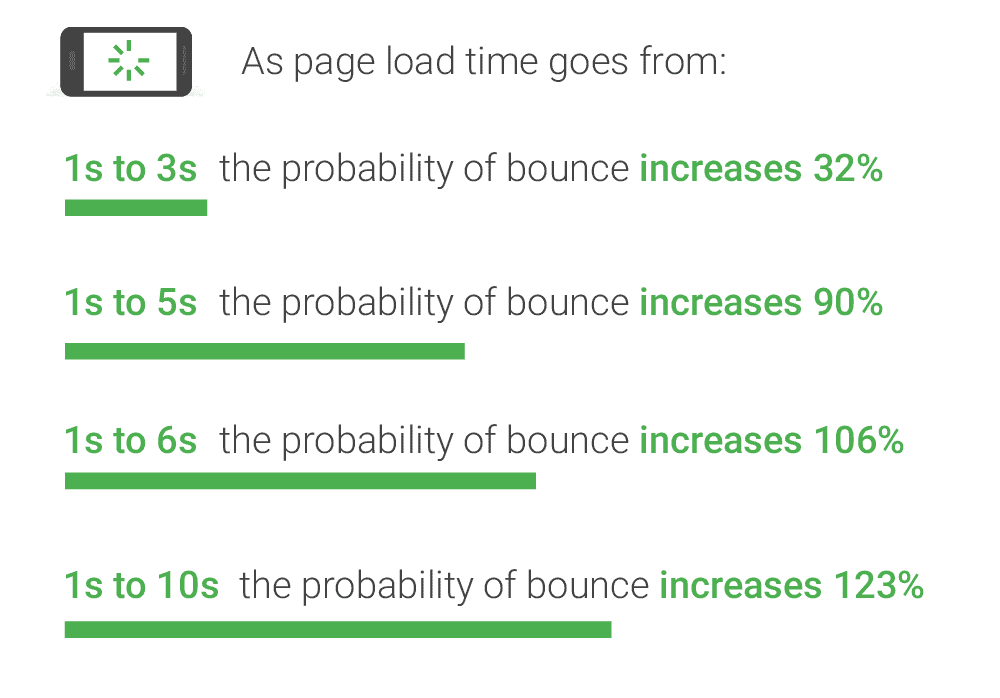
Image source: Google
- Click-through landing pages perform best for most industries, but 62.6% of landing pages use forms (Unbounce)
- A one-second delay in page-load speed leads to a 7% drop in conversions (Neil Patel)
- A typical landing page bounce rate benchmark is 60-90% (comedialabs)
- A mobile page load time of over five seconds almost doubles the likelihood of visitors bouncing (Google)
- 80% of a mobile visitor’s attention concentrates on the top of the page (OptinMonster)
- 37% of the top landing pages include testimonials (Nifty Marketing)
Landing Page Click-Through Rate Statistics
What happens when visitors click? Check out these landing page conversion statistics, including some from Taboola Trends:

- Images of people have a 66% higher click-through rate (CTR) than those of objects (Taboola Trends)
- The CTR for images without text is 52% higher than for images with text (Taboola Trends)
- Close up images are 24% more engaging than zoomed out images (Taboola Trends)
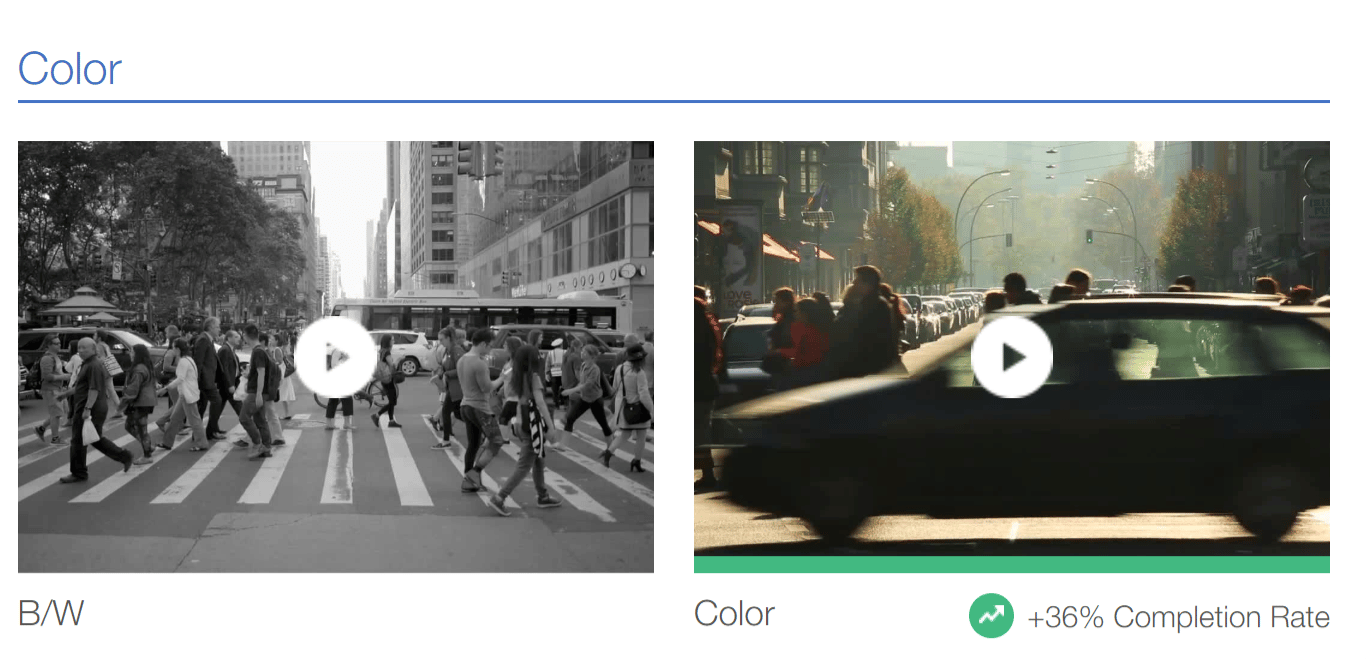
- Color videos have a 36% higher completion time than black and white videos (Taboola Trends)
- Navigation links reduce post-click landing page conversions (Instapage)
- Using click-to-scroll reduces bounce rate by 37% (OptinMonster)
Landing Page Best Practices
These landing page conversion stats and landing page best practices should prove invaluable when it comes to developing your own landing page strategy:
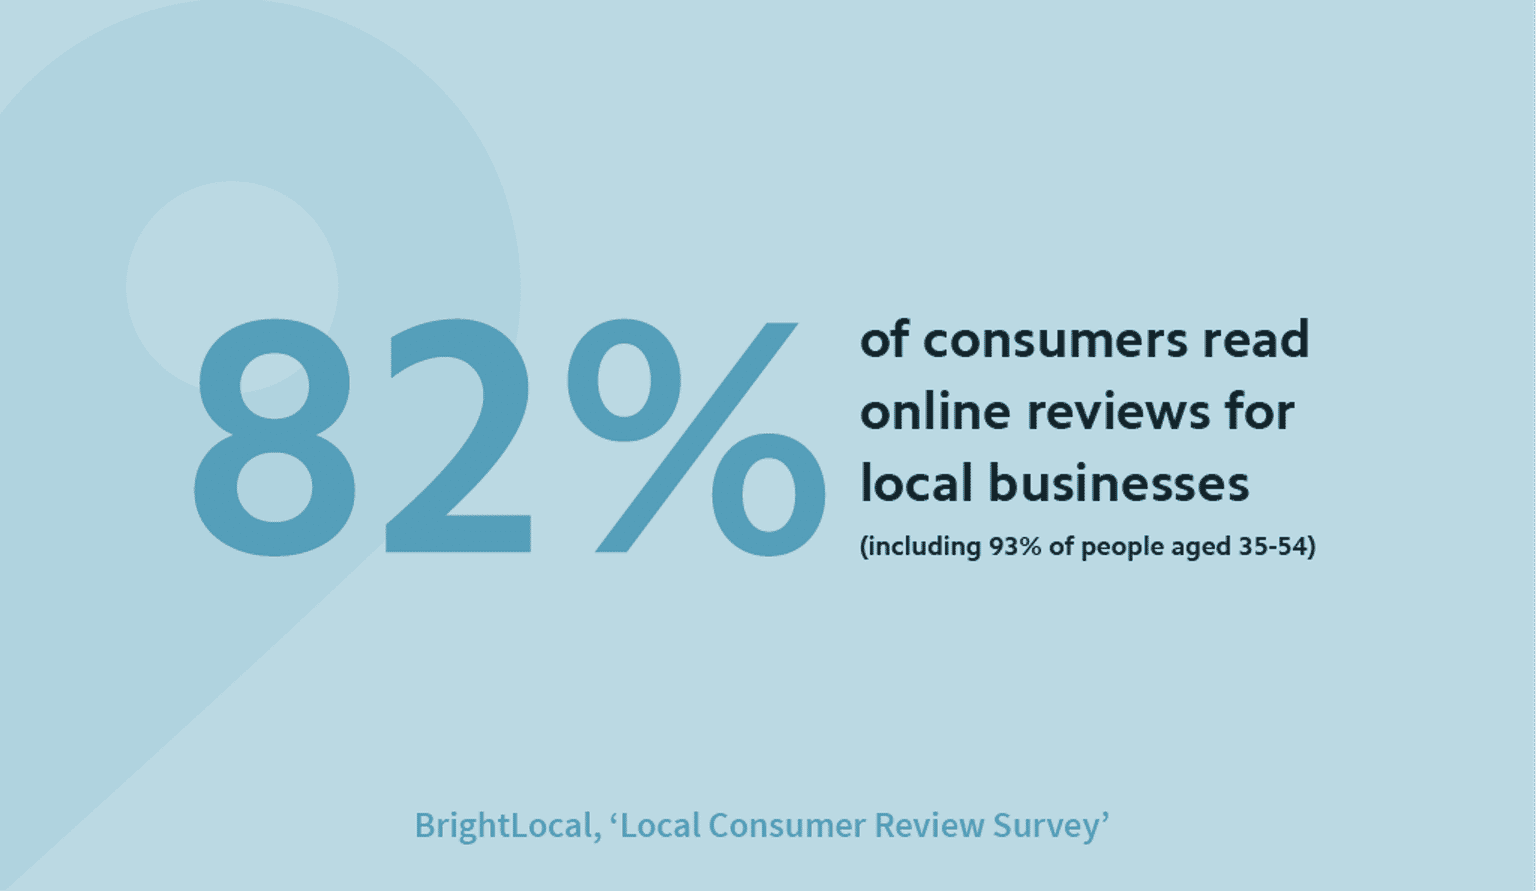
Image source: BrightLocal
- 82% of customers read online reviews and these help to build trust (BrightLocal)
- Using color boosts brand recognition and sales by up to 80% (Xerox)
- Including contact information builds trust (Neil Patel)
- Long landing pages can generate 220% more leads (Marketing Experiments)
- Images of real people perform better than stock images (Content Marketing Institute)
- 37% of the best landing pages include testimonials (Nifty)
- Using landing page videos can boost conversions by 86% (TechJury)
- 58% of landing pages include clickable graphics (Marketing Experiments)
- Personalized CTAs convert 202% better than generic CTAs (Hubspot)
Landing Page A/B Testing Statistics
Testing is key to identifying landing page conversion rate benchmarks and improving performance. Here are some eye-opening landing page conversion rate statistics relating to landing-page tests:
- Just 17% of marketers use A/B testing to boost conversion rates (Hubspot)
- President Obama used A/B testing to raise an additional $60 million (Event360)
- A/B testing is the most common method for optimizing landing pages and improving conversions (Econsultancy)
- More than 20% of businesses say they don’t have an effective testing strategy (Business2Community)
- Companies who saw improved conversion rates in the past year are doing, on average, 50% more tests (Econsultancy)
- Companies that use Conversion Rate Optimization (CRO) tools see a 223% boost in ROI (VentureBeat)
- Targeting and testing can increase conversions threefold (Steelhouse)
- Split testing is the best way to boost conversions (Neil Patel)
- 44% of companies use split-testing tools (Invesp)
- 61% of companies run five or fewer landing-page tests per month (Wordstream)
Landing pages are a common business tool, but not everyone uses them effectively. Use the landing page conversion statistics and landing page benchmarks in this guide to help you understand what’s working and what’s not working with your landing pages, so you can meet your business goals.