The US census happens once every 10 years, and it’s a pillar of the democratic process. But why is that? And how do we participate?
Citizens are required by law to respond to the census, so awareness and knowledge is critical. Since one of journalism’s core functions is to ensure an informed electorate, we decided to look into news coverage of the census to get a sense of the amount and type of information that’s reaching readers.
Let’s start with a tried and true measure of scale: Articles about Meghan Markle were about 165 times more popular than articles about the census in the 3-month period we studied!
Still we found thousands of articles and millions of page views about the census. Of those relevant articles, stories about political issues — including how the census is administered and how the results will impact congressional maps — were the most popular among readers.
Articles attempting to raise awareness about the census struggled to find much readership.
In mapping the census page views, we also found a connection between some states’ readership and historical census response rates, but no statistically meaningful correlation overall.
Let’s dive into the details.
Publisher Benchmark Report
The size and shape of census readership
In the 3-month period from December 2019 through February 2020, we counted over 2,700 articles receiving traffic on the Taboola network of news publishers. These articles generated 2.8 million page views from US readers in that time period, ranging from 217,000 to 11.
That’s about 9 page views for every 1,000 US citizens.
The Taboola news publisher network is very large. We partner with over 1,000 US news websites, including major broadcasters, the biggest local news networks and a wide variety of digitally native news companies, providing us insight into reader behavior across the entire online news ecosystem. In this sense, it can be used as a large sample of what people are reading on the internet.
To get a sense of scale for the US census readership, articles about Meghan Markle from a similar 3-month period generated over 460 million US page views. That’s 165 times more than the census readership!

We saw 35 million page views related to NASCAR’s Daytona 500 in February, which is when the race took place.
Let’s look at one more chart to complete the scale comparison. Here are those same three topics as compared to March page views of articles about coronavirus, which was by far the most popular topic we’ve ever had within a single month.

Now we know how much interest there was in the census as a whole, but what was the subject of these articles — particularly the most popular ones?
We categorized the top 200 articles (which accounted for 85% of the total page views) by article type, separating them into 6 topics.
- Results: Articles reporting specific demographic shifts and their implications for communities. These could be based on 2020 projections or other data released by the census in advance of 2020.
- Politics: Articles about the political issues surrounding the census, which mostly include the legal battle over a controversial citizenship question and how the projected results may influence congressional representation.
- Awareness: Articles that explain why the census is important and give information on how to participate.
- Jobs: The census bureau hires people across the country to help with this massive undertaking. A number of news stories were focused on publicizing these opportunities.
- Entertainment: Trivia based on census results in addition to satirical articles referring to the census.
- Other: Everything that didn’t fall into one of the above. These include stories about the Alaska town where the census begins each decade, and concerns about how tech failures and hacking could impact the count.


From looking at these articles and the page views they generated, we can get a sense of the amount of coverage and the relative popularity for each category.
The number of articles for each category was much more evenly distributed than the page views with three categories — politics, awareness and jobs — tallying more than 20% of the articles each.
When it came to page views, however, political stories greatly over-performed, capturing 40% of the traffic while awareness and jobs articles captured 10% and 6% respectively.
Entertainment stories were the highest performing in terms of page views per article.
To make one more comparison between political articles and awareness articles, we measured traffic to articles including keywords related to each topic.
Census articles with politically focused keywords including “congressional,” “districts,” and “map” had 2.4 times as many page views as census articles including awareness-focused keywords including “citizenship,” “respond,” “fill,” and “awareness.”
Census readership by state
To get an understanding of where census news is reaching the most citizens, we mapped the page views. Unsurprisingly, the largest states have the most page views. By normalizing the data based on population size, we can see which states have the most page views per citizen.
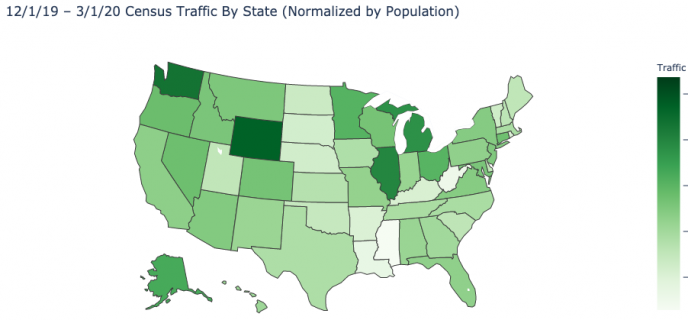
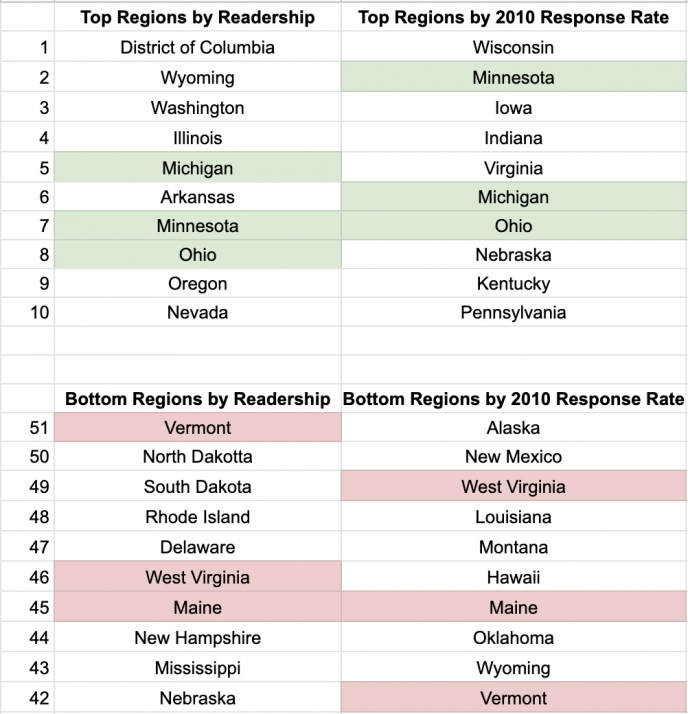
The District of Columbia, Wyoming, Washington state, Illinois, and Michigan are the regions with the highest density of census readership. Mississippi, West Virginia, Louisiana, Rhode Island and Arkansas were the regions with the lowest readership density.
If readership is a good measure of awareness, it’s possible that areas with higher density may be more inclined to respond.
Comparing readership by state with response rates to the 2010 census — the most recent participation data available — we found an extremely weak statistical relationship between the two datasets.
Of course, this is a very imperfect comparison because there is a 10-year gap between the 2010 responses and 2019-2020 page views. What will be more telling is to see if our page views correlate to 2020 response rates, which we can do once the government releases that data.
Even so, there were three states among the top 10 for both readership and 2010 response rate, as well as three in the bottom 10 for both.
Learn more about the 2020 census
Since the point of this research was to assess how much news coverage is impacting census awareness, we wanted to highlight some of the fantastic articles from our publisher partners that are informing citizens about their civic duty to reply.
- USA Today – What is the census and how is it used? Here’s what you need to know about the 2020 census
- NJ.com – The 2020 Census is coming, with one huge change. Here’s what you need to know.
- New York Daily News – ‘Hamilton’ creator Lin-Manuel Miranda, AOC team up to boost Census participation with PSA
- WSB-TV Atlanta – U.S. Census Bureau: Don’t fall for scams, rumors about 2020 census collection
- NBC News – New census ads speak to Filipino, Vietnamese, other undercounted Asian American groups
- Federal News Network – Decennial census, IRS IT modernization: Here are the major agency projects to look for in 2020
- Chicago Tribune – The government will try to count the entire U.S. population this year: Here’s what you need to know about the census — and why it’s so important for Illinois
- Al.com – ‘Alabama Counts’: How one Republican state bucks national trends and boosts Census awareness
How you can view Taboola’s trending topic data
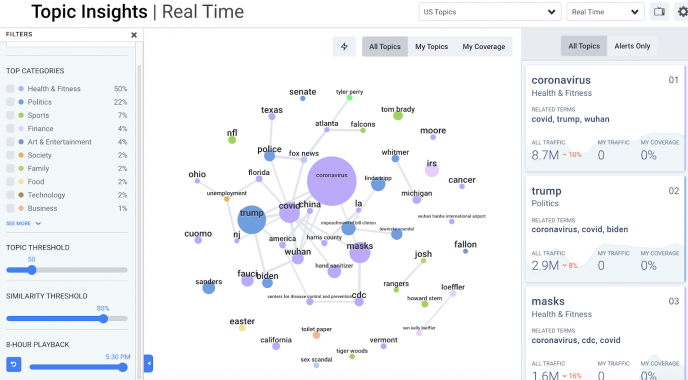
Taboola’s news publisher partners have access to data on trending topics in the Topic Insights part of Newsroom, our real time audience analytics platform.
Taboola Newsroom helps publishers’ editorial teams understand not only the biggest topics overall, but also the most popular among audiences on social media and search. It also lets publishers foster audience loyalty by letting them understand the topics core audience members are reading on their sites and elsewhere on our network.
It’s a fun bubbly-matrix filled with useful data. Here’s how it looks.
There’s also a publicly available version of Topic Insights on our Taboola Trends page.
Beyond these options, we’re always looking for interesting ways to use our data to help bring context to how news readers are interacting with real-world events such as measuring which presidential candidates are getting the most attention.
Feel free to DM @franberkman on Twitter if you’re doing any research or reporting that you think our data could help support.