Introduction
Newsrooms are under constant pressure to deliver the most up to date, relevant, and engaging information possible. At Taboola, we are building tools to make this faster, easier, and now–predictable. As soon as an article is published the team has a critical eye on engagement data. Garnering insight on article performance as soon as possible is critical for guiding content strategy. Some articles receive wide attention immediately, drawing hundreds of thousands of page views within minutes, others may only see the first page view after a few hours.
Taboola aims to narrow this gap even further by leveraging Machine Learning Models to predict article performance the moment after it becomes available to the reader. Read on for details on our latest research and fascinating discoveries around predicting article performance!

Article Data
Taboola Newsroom is a real-time optimization technology that empowers editorial teams with actionable data around what stories, headlines, thumbnails and placements generate the maximum engagement across desktop and mobile. When enabled, it constantly processes all the traffic and engagement data from the publisher. For example, all article page view traffic is grouped by source, location, and platform. For the models below, a one-minute time interval is used to understand the article data.
Because different publishers may have distinctively different user engagement patterns, our preliminary research models focus on one US main-stream publisher in 2017. Using articles published in a one-week span, traffic from the first two hours post-publish is shown in the following figure. The majority of articles are published during working hours and popular articles usually see substantial traffic immediately.
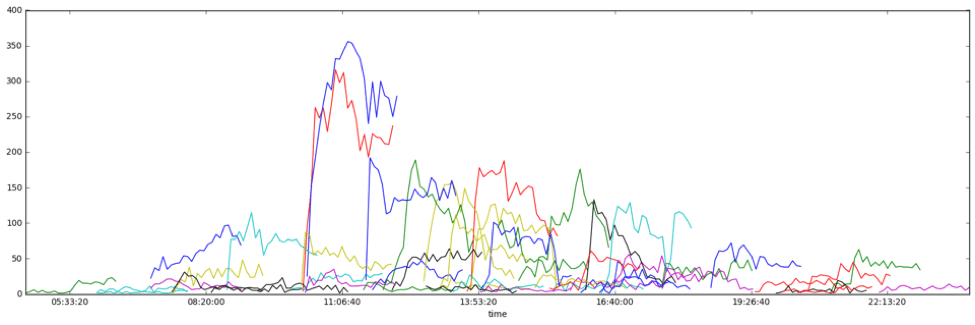
All articles exhibit different performance trends, but among those differences there is no clear pattern that can be determined. Though other article-related information may have an impact on performance (such as author, article category, time of publish), that data is not used in this chart.
Models
We used multiple machine learning algorithms to analyze the news articles, three of which have the results explained below. To maximize the applied value of the models, traffic data is limited to the first 30 minutes post-publish.
a. PageView Model
Total number of page views from individual articles is an important measure for publishers; by knowing the projection of pageviews, it could help them to promote potential articles as early as possible and replace less-engaged articles with better ones.
The target was defined as total page view traffic of each article in the first 24 hours post-publish. Several feature engineering efforts were applied:
- Because the minute-level traffic is sparse for low-traffic articles, time-windows of different length were used.
- Categorical features such as author, news section, and location were encoded and converted to numerical features.
- Low-traffic geographic regions were grouped together.
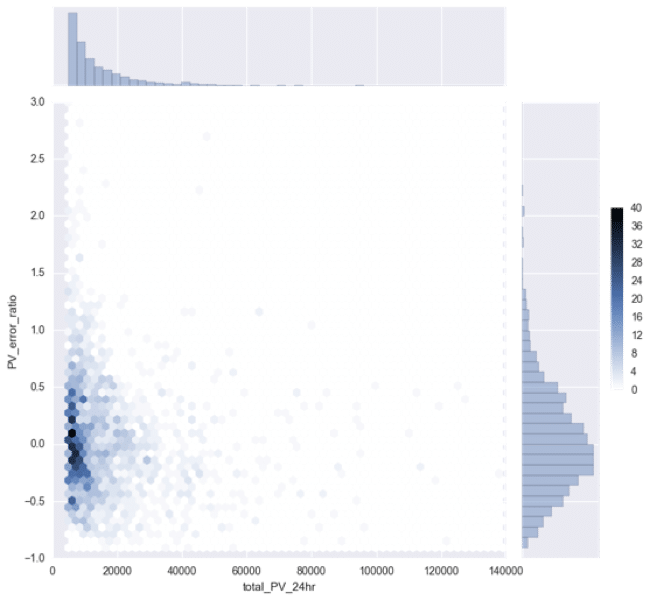
A gradient-boosting-tree based model was built to predict targeted pageviews. The pageview error ratio, pageview error divided by total pageviews, is shown as a function of pageview on the left.
The prediction can vary from actual pageviews due to changes made to articles after the first 30 minutes, such as sharing on Facebook. These actions will change the total traffic drastically but are not considered in this modeling. In all, this preliminary model has about 35% error rate.
b. Popularity Model
In this model, rather than directly predicting specific page views, a classification model was considered. Some articles demonstrate great potential in drawing attention early; being able to identify and promote them in the early stage will give the publisher an advantage over their competitors.
We set a pageview threshold to label articles with potential for gaining mass popularity. A model was built to identify these potential articles. The red-dash line in the histogram below represents the threshold.
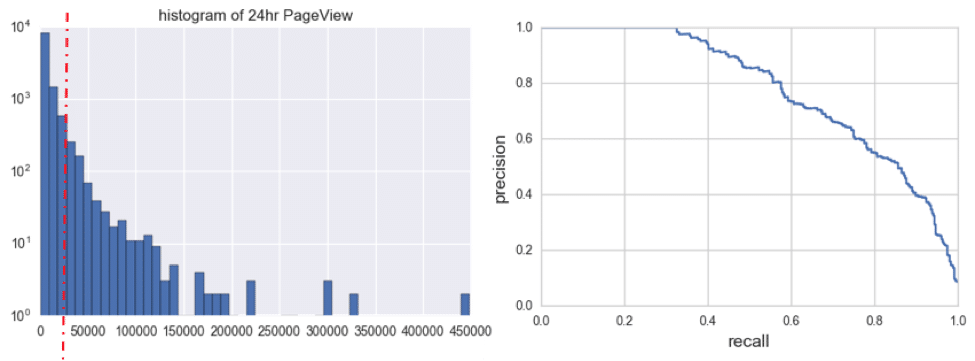
After building the model, an arbitrary threshold was used to separate articles. This threshold provides a trade-off between precision and recall as shown in the right-side figure above. In general, this model can capture more than half of the popular articles at 85% precision level.
Deep Learning Model
Because the traffic data is connected in sequence and organized in the same structure recurrent neural network (RNN) is a good candidate for modeling structure.
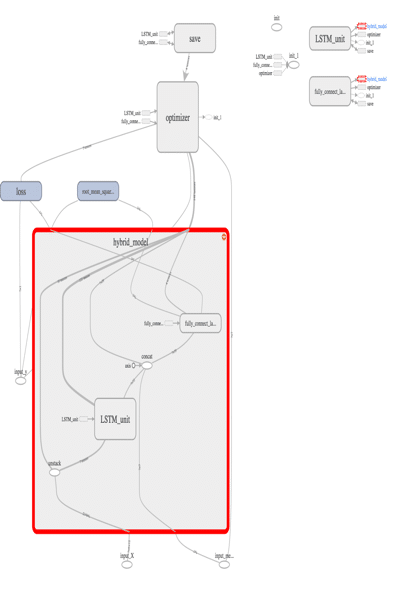
A hybrid model was built in TensorFlow to predict the total traffic in a 24-hour window; the corresponding graph is shown. This hybrid model contains two parts: an RNN and a fully-connected-layers (FC-layers). The output from the first RNN was concatenated with categorical features and fed into the second FC-layers.
An Adam optimizer with decaying learning rate was used to train this regression model. Without any further hyper-parameter tuning, this model has a similar prediction accuracy (root-mean-square-error) to the PageView model, but it has the highest potential.
Summary
The application of machine learning models has shown great potential in understanding the traffic trend of news articles. With as little as traffic within a few minutes, models can identify the popular articles with a good balance between precision and recall. The preliminary deep learning model such as RNN also demonstrates similar performance to the traditional models (with careful tuning). The deep learning model should be expected to exceed with fine tuning in the long term. Taboola will use this experiment to continue building tools that support Editors and Authors in Newsrooms as they refine and adjust their content strategy.