Across all aspects of a publisher’s business, data is critical. The newsroom is no exception, but introducing data into your newsroom in a productive way can be challenging. According to a recent survey conducted by the International Center for Journalists:
Less than half of newsrooms consult data on a daily basis which indicates a real opportunity for education on data and how to use it.
While it was rare twenty years ago for journalists to use site analytics data in any real way, the move to digital-first operations has brought a new challenge: too many tools and too much data.
It’s important to introduce data into your newsroom in a way that is easy to consume, easy to act on, and leads to meaningful results.
I’ve included some broad steps here for introducing (or, focusing on) data in a newsroom based on what I’ve learned from more than a decade of consulting with news organizations for analytics and strategy.
1. Identify high-level company objectives
Identify which of the company-level goals the newsroom can support. Talking about pageviews is fine, but it’s likely that your organization has higher-level goals around more specific outcomes like the following:
- Driving print and digital subscriptions
- Unique visitor reach
- Visitor engagement
- Visitor loyalty
- Revenue
You should choose metrics to focus on in the newsroom that support these broader goals.
2. Set measurable and actionable KPIs that contribute to those objectives
These KPIs will determine which metrics you pay attention to and talk about in the newsroom. Make sure that the KPIs you’re setting are meaningful to the greater objective and can be directly influenced by the editorial team.
Example: Local News Publisher with Subscription Goals
For example, if your company is a local news publisher focusing on doubling digital subscriptions in 2020, consider which metrics influence visitors to subscribe to your content. To identify the right visitors to target, you might focus on the frequency of visits and location of the visitors as two strong indicators of the propensity of a visitor to subscribe.
To support this high level goal of doubling subscriptions, you might set the following newsroom KPIs:
- Increasing monthly unique visitors in your DMA by 20%
- Increase frequency of visits by doubling newsletter signups
- Increase frequency of visits by tripling visits to your mobile apps
Don’t fall victim to vanity metrics.
If you set a goal of increasing pageviews by 20%, you might be able to hit this goal just by adding photo galleries to every article you post. How much do those gallery pageviews really ladder up your high-level objectives, though?
A mentor of mine refers to tactics like this as focusing on “empty calorie pageviews.” In nutrition, empty calories are defined as foods and drinks that supply food energy, but are low in nutritional density. In journalism, empty calorie pageviews may increase a specific number, but they hold very little value for broader goals and objectives. Sure, they’ll help with the vanity metric of pageviews but they’re unlikely to contribute meaningfully to revenue or the KPIs you care about.
These vanity metrics can be fun to talk about, but don’t always relate to any KPI.
Your marketing team will have a number of different things that they do to increase subscriptions via all of their marketing channels, but it’s important here to focus on the things that newsrooms can influence directly. Review your KPIs regularly to ensure that the company goals haven’t evolved and that they’re directly influencing those goals.
3. Choose the right analytics tool(s), and make sure they’re configured correctly
Today, many newsrooms are simultaneously using:
- A tool to measure long-term success (Adobe/Omniture, Google Analytics, Parse.ly)
- A tool for real-time data (Taboola Newsroom, Chartbeat, Parse.ly)
Each tool brings with it its own costs and benefits.
Perhaps more important than choosing the tools themselves is configuring them correctly, since incorrect data can be more destructive than not having any data. Make sure each tool is tracking the whole site consistently so you have a clear picture of engagement with your site.
It astounds me how many groups I’ve worked with that have different tools measuring different physical parts of the site and don’t have a single clear view of traffic and metrics—this leads to a lot of confusion.
Example: International Sports Publisher
An international sports publisher uses two tools: Chartbeat and Omniture. They’re covering the Tokyo 2020 Olympics next year, and want to have a clear picture of how site visitors are interacting with content about the Olympics. When the newsroom looks at Chartbeat, they can see performance of gallery pages and Instant Articles, but they can’t see performance on AMP pages or in their app. In Omniture, they see AMP and app traffic but aren’t tracking Instant articles.
Without integrating this data, different teams are looking at different data and guessing at which types of content are the most engaging, and are likely missing out on opportunities for engagement and monetization.
4. Make sure the entire team has access to real-time metrics
Everyone in the newsroom is busy and has dozens of tools that they use every day. Remove as many barriers to accessing the most important analytical data as you can. Your team is a lot more likely to use the data if you bring it to them rather than make them log in to a tool to search it out.
Display your data.
Most analytical tools have a “TV view” that you can customize to display on television screens around your newsroom. This is well worth the investment in monitors or TVs––make sure everyone can see the metrics as they walk to or from their desks.
Example: National Breaking and Social News Publisher
At a publication that covers the biggest stories of the moment, the whole organization needs to know ASAP if one of their stories is blowing up. With a TV view showing real-time pageviews displayed on several monitors around the newsroom, everyone can see when they’ve produced a hit. At times, the editor-in-chief will quite literally burst out of his office to celebrate a story that’s spiking.
The audience editors know to feature these stories on the homepage, social channels, and to consider it for a push alert. The section editors and reporters then brainstorm how to move the story forward through updates or follow-up posts. In addition to creating excitement in the newsroom, the TV display has created a common understanding on how to take action based on audience metrics.
Automate reports.
Each team member will likely want or need different reports delivered to them as well. Monthly views are great to track your KPIs, but giving authors and producers easy access daily or weekly reports will be much more useful to actually hit those KPIs.
Make sure these reports are delivered to them via email or Slack so they don’t have to seek out the data, and they’re much more likely to consume and use it!
5. Build a common understanding of what the metrics mean
As you invest in bringing data into your newsroom, make sure that the team has a common understanding of what each metric means and what action they should take when they see something change in that metric.
Run training sessions.
Formalized training sessions are really useful here, and it’s important that you have resources available to answer questions. The metrics won’t be useful to your team if they don’t understand what the metrics are and how they’re measured.
While top-level metrics like unique visitors, visits, and pageviews might be easy to explain, this will get more challenging if you have KPIs around engagement.
Some sites will focus on “time on page” or “engaged time”, but there are dozens of other ways to track engagement. If you walk into your newsroom and say that a particular story had low engagement, different teams would likely assume you mean different things: some would think the story is low on pageviews, some would think people aren’t reading the entire story, and some would think users aren’t scrolling through a gallery or watching a video. Making sure you have a common understanding about what “engagement” (or any other metric) means for your teams will give everyone a shared understanding of what actions can be taken.
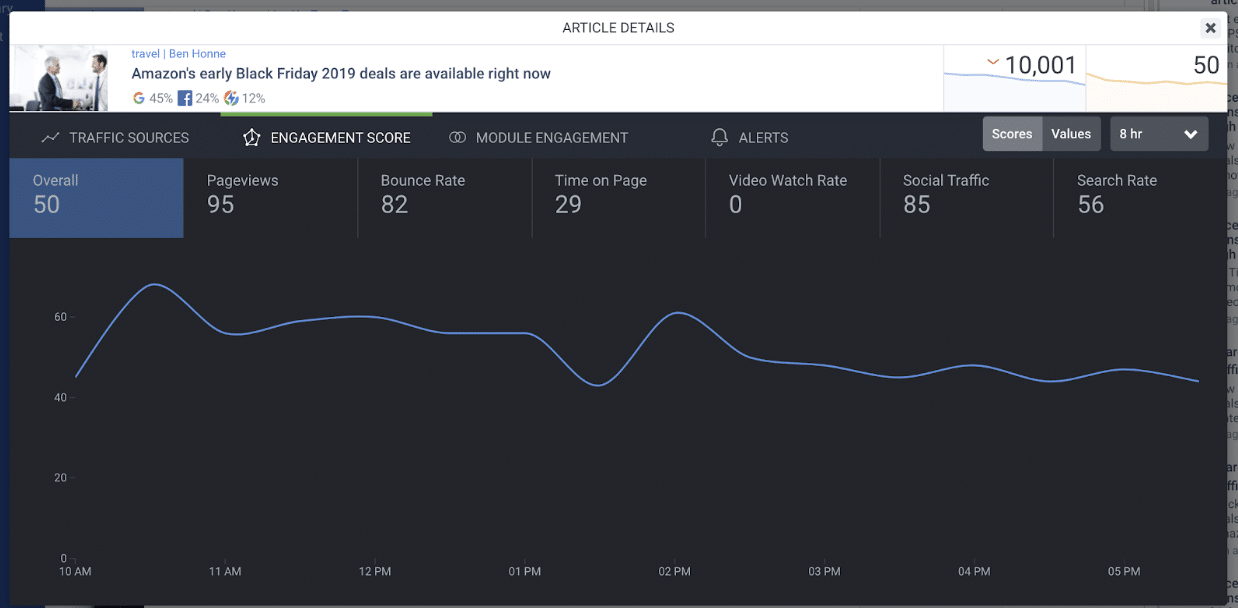
In Taboola Newsroom, we try to simplify engagement by showing six different engagement metrics scored out of 100 and allowing each publisher to change how these add up to an overall engagement score to focus on what’s most important to them. Even with this simplification it’s important for everyone that sees it to understand how the score is calculated.
6. Measure and contextualize data ahead of big decisions
If you know that you’re going to be making big changes to how your site operates such as redesigning or changing a paywall, make sure you’re tracking the data you need and use this data to influence your decisions.
Plan to measure before making strategic moves.
It’s worth investing in analytics changes to make sure you have the data you need ahead of such decisions rather than guessing and measuring impact after the change.
Example: Enterprise News Publisher
I once worked with a news publisher that was both going through newsroom layoffs and simultaneously making changes to how their paywall worked in the same quarter.
The leadership identified that sports content had a lower contribution to pageviews than it had to content costs—the outcome was that they laid off much of their sports staff. As they then tightened their paywall, they didn’t see the subscription numbers that they were expecting.
I came in later and looked into their historical analytics to help explain what they were seeing—it turned out that the sports pageviews mostly came from a small but dedicated group of users. In decreasing their sports coverage, they gave those dedicated users less motivation to subscribe.
While staffing decisions can’t be made based on data alone, and having this data might not have changed the outcome for the staffers that were let go, having this data could have helped educate that decision.
7. Regularly look back in time to learn from performance
In addition to using data in real time, and using data to make decisions, it’s also important to look at a team’s performance for big news events and learn from the data what to do differently for the next big event. I always recommend making this process as concrete as possible, and focusing on learning rather than grading.
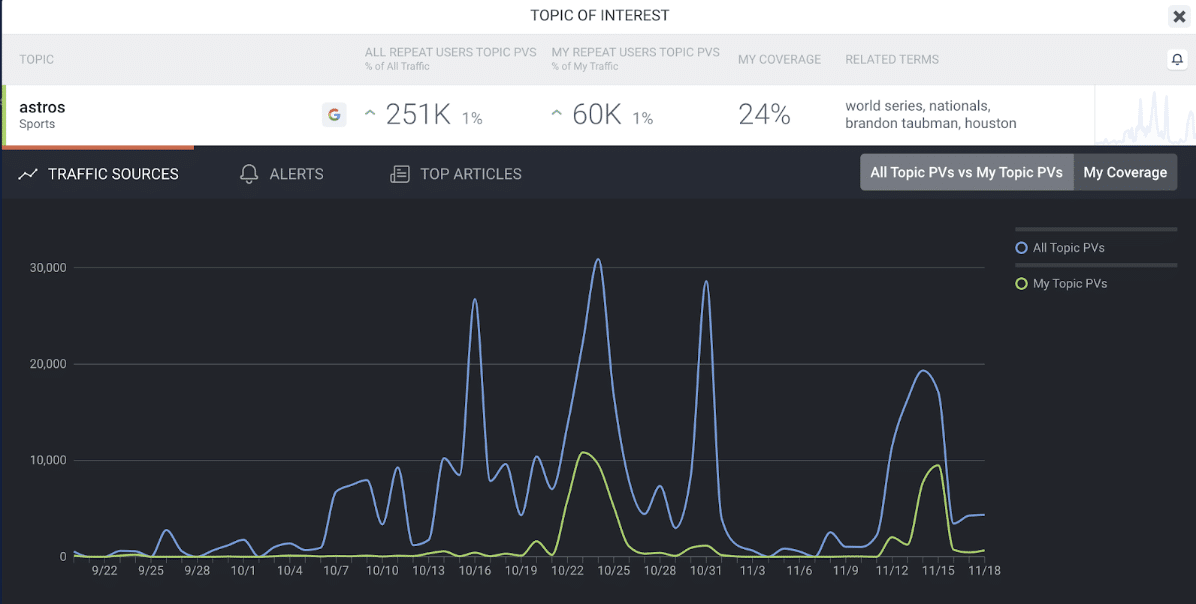
Publishers can use our Topic Insights tool to look back in time to see whether their frequent visitors came to their site or other sites on the Taboola network for news about a topic.
Example: Sports News Publisher
As seen in the screenshot below, a site saw pageview spikes from their frequent visitors for Astros stories on two key dates––October 23rd, when the Houston Astros fired an assistant manager, and on November 4th when news broke about the Astros stealing signs.
While our network (blue line) saw a large increase for this site’s visitors around the Astros’ 2019 World Series games on other dates, there was no pageview spike on the site. This speaks volumes about the type of content this site’s frequent visitors are interested in, and can inform the way the site promotes real-time game content during the next big sports event.
8. Experiment Frequently and Measure Obsessively
Measuring and reporting on the metrics that support your goals is necessary, but measuring won’t lead to your teams hitting those KPIs alone.
Encourage your teams to brainstorm new ideas and try different things to hit those metrics.
Everyone brings their own recipes for success based on their own experience, and sharing what works or doesn’t will help everyone learn from the outcomes and will surface best practices. As you surface those best practices, you can formalize them into repeatable processes that will lead to consistency in action and decision making.
Example: International News Publisher
My favorite example of experimentation comes from a site that was trying to increase pageviews from Facebook by immediately posting to Facebook when news broke, then later posting again with a link once they had a story on their website.
This didn’t quite lead to the traffic or engagement they were looking for, but going through this process lead them to streamline operations so that breaking news stories got posted to their websites much more quickly, which lead to capturing the viral traffic patterns and doubling breaking news traffic from Facebook.
I might not recommend going as far as Facebook’s much-vaunted “move fast and break things” culture, but I’m a firm believer that trial and error is necessary to really drive changes in KPIs.
Introducing new data into a newsroom, and making sense of the data you already have, is a huge and challenging project. It’s a fun and important challenge, though––when done well it’ll help your team be more efficient and hit their KPIs.
If you want to chat about data in your newsroom, or are a Taboola publisher that wants access to our Newsroom dashboards, please reach out to me on Linkedin or ping your Taboola account team for an introduction!