
It’s a brand new decade, but we’re taking one last look back at 2019 to consider what’s become an age-old question: How are people getting their news on the internet?
To do this, we aggregated data for all the news sites that use Taboola Newsroom, our real-time audience analytics platform from October through December. The dataset represents traffic to articles on hundreds of news websites globally, totaling over a billion article views per week.
Our news partners include big national publishers, local newspapers, digitally native outlets and everything in between.
For this analysis, we focused on US websites, occasionally using data from other regions for context.
Without further ado, here are five trends to help you better understand how people on the internet got their news in late 2019.
1. Social Traffic Resurgence
After years of chasing scale and virality on Facebook, the past several years have been defined by news publishers refocusing on both SEO and cultivating loyal, returning audiences.
It was a dramatic shift sparked by years of frustrating Facebook algorithm changes, culminating with a January 2018 shift that specifically deprioritized news content in the News Feed leading to a large decline in traffic for many news sites.
But over the course of 2019, news traffic from Facebook began to stabilize. While search and direct are still the two largest referral buckets, we saw social traffic tick consistently upward in terms of percentage of traffic.
It’s too early to understand the magnitude and durability of this trend. In part, because the final few weeks of the year are not typical with people taking time away from work around the holidays.
We’ll be keeping an eye on this one into 2020.
2. When Will Instagram Catch Twitter? Or has it already?
Let’s stay on the topic of social media for a minute.
Even with the issues and headaches, no other platform is coming for Facebook’s social traffic referral crown anytime soon. Facebook drove anywhere from 12% to 21% of weekly traffic to sites of publishers who use Taboola Newsroom in aggregate.
Down in the 1% to 2% range, Twitter and Instagram are battling to be number two.
Twitter was central to information collection and dissemination, as well as news story distribution, for basically all of the past decade. But it has never achieved the mainstream usage of Facebook so despite its importance to the information ecosystem, it never became a major traffic source.
Instagram’s user base has been surging for years but it’s only relatively recently become a player in the traffic referral game with the introduction of deep linking in Instagram stories and advances in “link in bio” widgets.
We saw one week in the last quarter of 2019 in which Instagram had a higher percent of traffic referred than Twitter to publications that use Newsroom.
There are a couple of important factors to consider here.
- First, compared to Twitter, which most every news publication uses and has a clear idea how to optimize, fewer publications have figured out how to fully utilize Instagram as a traffic source. So it’s a handful of very successful outlets that are driving the Instagram traffic numbers.
- Second, Instagram traffic is a bit trickier to track than Twitter traffic. Audience analytics tools like Newsroom often require UTM codes to reliably attribute Instagram traffic.
This means it’s possible that Instagram is already driving more referrals than Twitter. Even if that’s not the case, it seems like an inevitability as more news organizations figure out how to build their Instagram audiences and turn them into readers.
3. Where in the World is Direct Traffic?
We discussed earlier the push toward cultivating audience loyalty. A returning reader is someone who likely understands the value of your news brand and reporting, and they may even be willing to pay for a subscription or membership.
Though it’s not a perfect measure, direct traffic is the best indication of audience loyalty. If someone is bookmarking a site or typing the URL into a browser bar, that’s an extremely strong signal.
When we look at the US against other regions around the world, we see it compares favorably to Asia and Latin America when it comes to direct traffic.
But EMEA (technically “Europe, Middle East and Africa,” but most of our publisher partners from this region are from Europe) is far and away the leader with direct accounting for more than half of all traffic.
As with the other trends we’ve discussed there is one catch here (nothing is simple with big data sets). Our dataset focuses on article views, not homepages and section fronts.
So, our direct traffic includes views to articles after a person went directly to a homepage, but it also includes so-called “dark social” article views, or traffic that doesn’t include a referral source. This could be messaging apps, that hard-to-track Instagram traffic, or a handful of other options. It’s difficult to untangle how much dark social impacts direct traffic across regions.
4. The News Aggregator Horse Race Continues
Of the five news aggregators we monitored over the last quarter of 2019, four of them spent at least one week as the top traffic driver of the bunch.
Flipboard was most consistently high performing. The Drudge Report reached the highest highs. Newsbreak was at the bottom of the group but ticked up steadily over the 3 months.
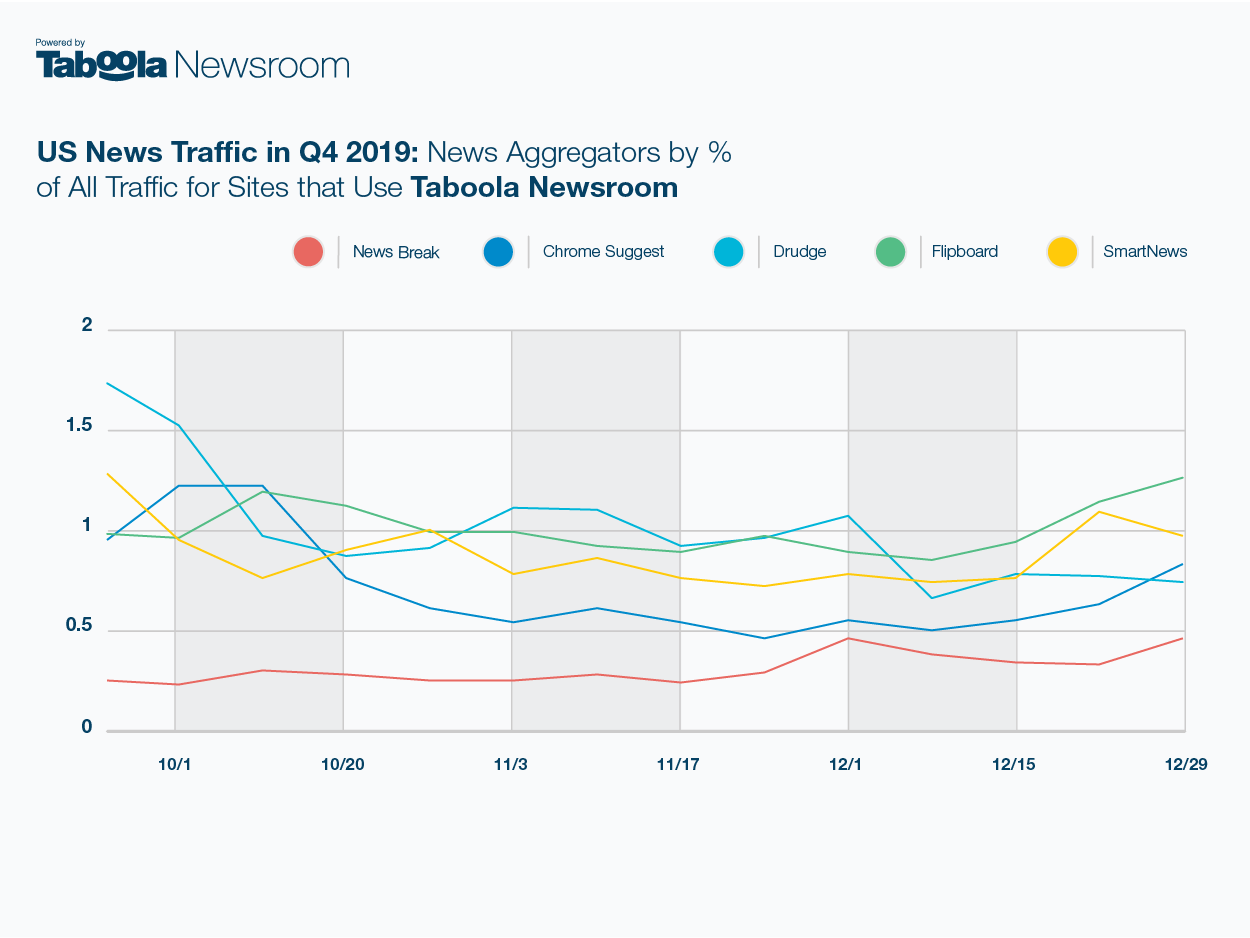
The takeaway here is these apps and websites will likely remain small but significant traffic drivers, but there’s not just one to focus on. It feels great for reporters and editors to get a surge of well-deserved traffic when these sources shine their spotlight on your high impact work, so it’s worthwhile to try to build out these relationships where there’s potential.
5. Holiday Traffic Slump
Almost every news publisher sees website traffic drop off around the holidays. There’s less staff, and usually less content, not to mention readers are preoccupied with their own festivities.
But how much of a dropoff should you expect?
Based on aggregated data from all US publishers who use Taboola Newsroom, there should have been a small dip around Thanksgiving, a medium dip around New Year’s, and a large dip around Christmas and Haunakkah.

The chart represents the aggregated traffic, but it’s important to consider how your site may be different. For instance, a news site that writes a lot of articles about Black Friday deals may have seen a surge during Thanksgiving week.
Notes on the data
The dataset is based on several hundred news sites that use Taboola Newsroom around the world. The trends here focus on the US subset of publications.
Newsroom captures information for pages that include the Taboola Feed and other content discovery widgets. This means we mostly measure article pages and some video pages.
Finally, our company focus is the open web, which mostly includes news publisher websites as opposed to walled gardens controlled by big tech platforms such as Facebook’s Instant Articles, Google AMP pages and Apple News. Our ultimate goal is to help news publishers grow their traffic where it will have the largest impact to their business, which is on their owned and operated platforms.
The data set includes partial traffic to some publishers’ AMP pages and Instant Articles, but the trends presented above most thoroughly represent traffic to publisher websites.
Note: We’ll be updating these trends and reporting new ones every few months. Follow the Taboola Blog for more. You can also DM @FranBerkman on Twitter if you have questions or if you’re conducting research you think our data could inform.