
You wrote your code. You even tested it. And now, you are eager to git push it. But how can you verify that it really works? In Taboola, we test our code in production!
In this article, you will see how every software engineer, even on the first day in the company, can test in production – all thanks to a dedicated Jenkins pipeline job and lots of metrics.
How hard is it to test in production?
Quite hard. You probably already knew that. Everybody fears that moment when they need to test changes in production. The main reason is that not everyone has the required IT skills. Moreover, people have to repeat error-prone, manual tasks – which might result in downtime and revenue loss.
For our release engineers, it was also an unmanageable headache – a “thundering herd” of developers eager to test their features in production.
The problem – tedious, manual, error-prone tasks
The process of testing in production was manual and tedious. Each developer had to deal with (at least) the following:
- Judiciously choose a server in production
- Make sure that the datacenter is not under stress
- Take the server out of the load balancer
- Install the feature branch
- Perform functional and non-functional tests
- Somehow verify that no performance degradation was introduced
- Rollback to the previous version
- And plenty more…
We can all agree that this is too much for a human to memorize!
Solution – Jenkins pipeline does it all
Our release engineers built a fully automatic pipeline for verifying and testing – rapidly and easily – in production. In order to use it, all you need is a feature branch, and then – the magic begins:

PREPARE |
|

TEST |
|

WRAP UP |
|
After a few hours, the Jenkins pipeline ends and rolls everything back, like nothing ever happened!
You get an email with the results
The comparison script reads from Prometheus and Elastic. It verifies that the basic KPIs didn’t drop and that error logs didn’t peak above the allowed threshold.
Below, you can see examples of these email messages, for successful and unsuccessful test results.
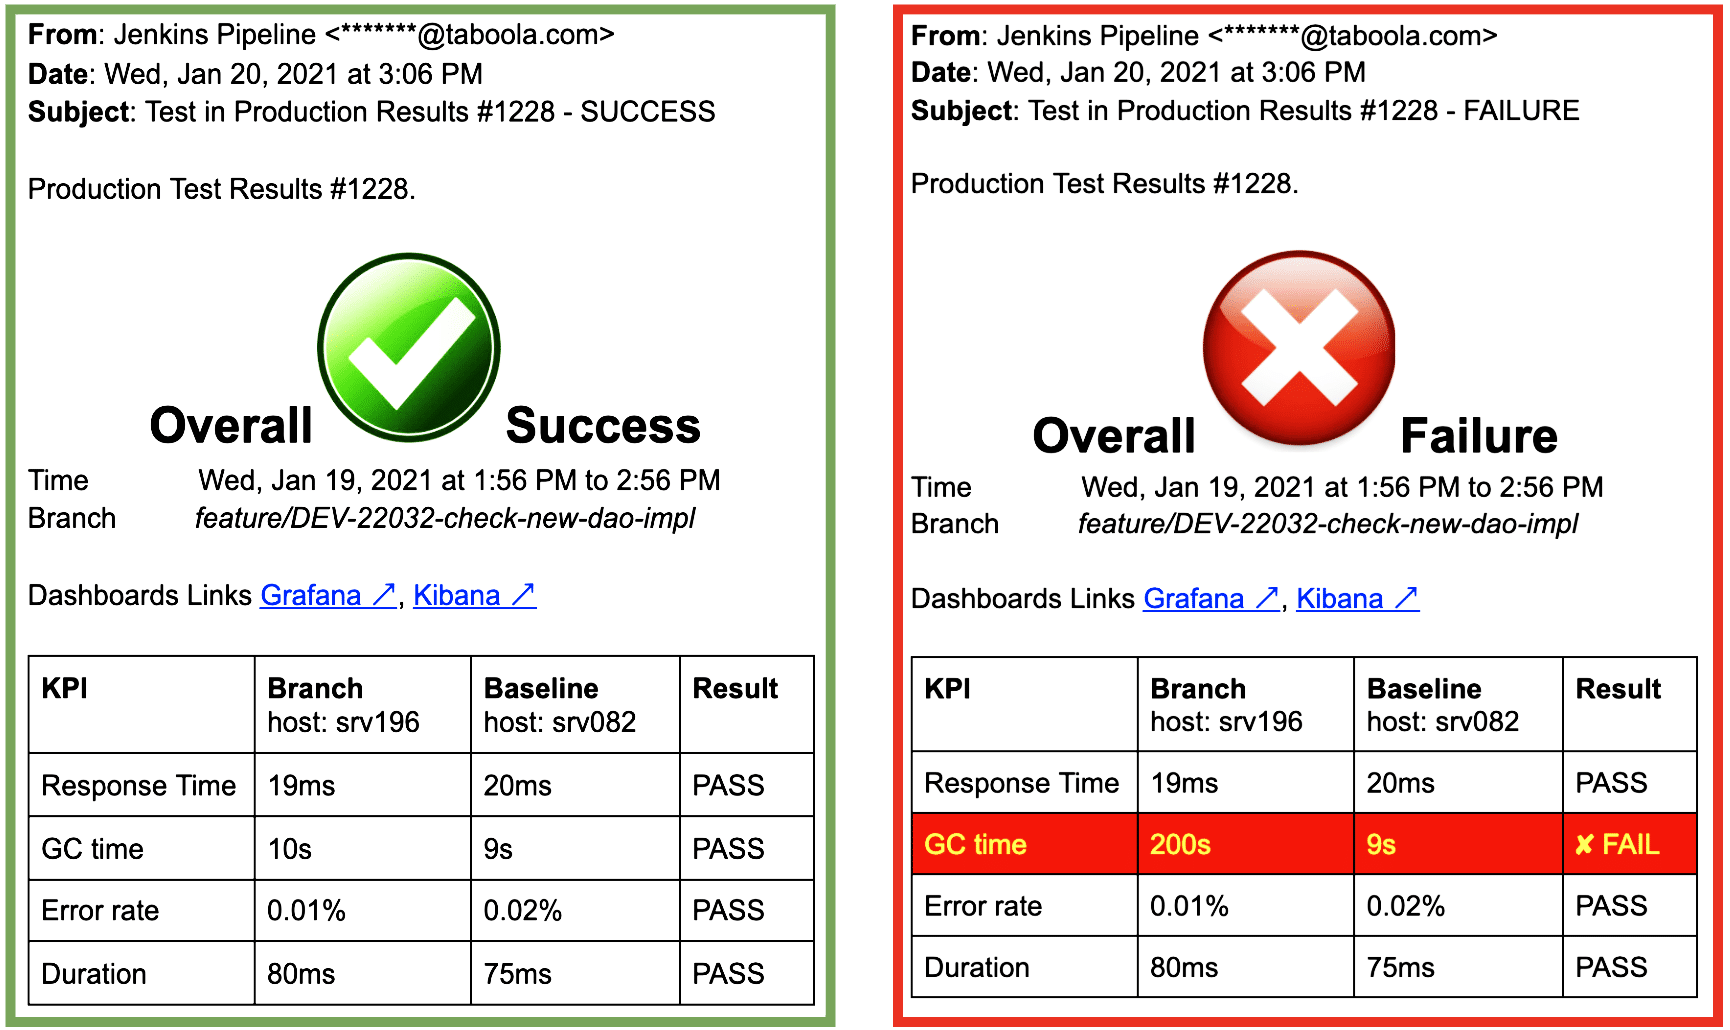 Success Email (in green) vs. Failure email (in red)
The comparison failures are highlighted – so it is very simple and straightforward to decide if your feature is ready, or needs more work.
Drill down metrics in Grafana and Kibana
To visualize the comparison results in one place, ad-hoc Grafana and Kibana dashboards with the relevant test time frames are created automatically. The links are sent by email and #slack.
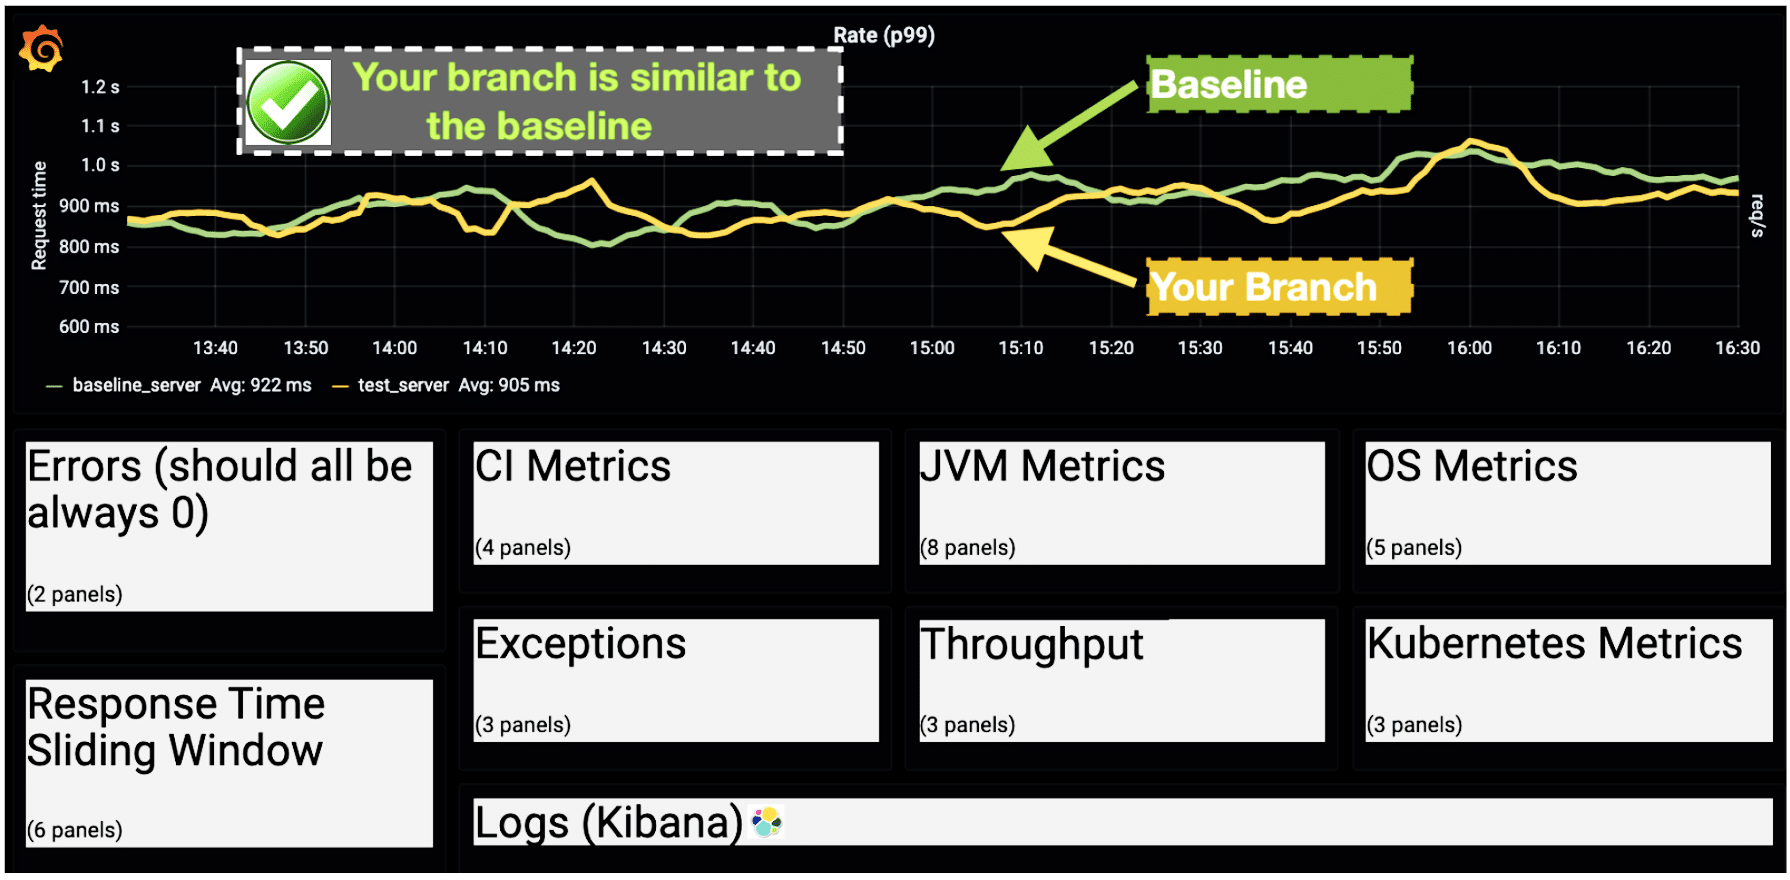 Example drill down Grafana dashboard
Main branch is tested in production every 2 hours
Actually, our release engineering teams use this method as a mandatory phase for validating new releases, and as an ongoing validation, every 2 hours. We continuously verify that the main branch is healthy. By doing that, we prevent bad code from entering production as early as possible.
What did you just read?
You just met a real continuous deployment enabler. The benefits of such a process is a fast, stable delivery process with improved quality. This is as close as it gets to the ”real thing”. This is a win-win for developers and release engineering teams, and of course, for the customer.
Do you also need such a solution?
Would you agree that now is a good time to start automating your testing on production?
Feel free to reach out to us, we will be happy to share more details.
– Co authored with Tidhar Klein Orbach