Today is the big day – you’re finally launching an exciting new feature that you’ve worked on for the past few weeks. The feature’s released, so you test it yourself, and it’s working! Customers will be able to use it now!
But soon you begin to wonder How many people have started to use it? How many times? How did they use it? Did they get any errors? Does it save them time? Does it improve the bottom line?
The last question requires further analysis and diving deeper into the data, but the first ones can be answered by looking into usage data and asking users for feedback.
As a UX lead, who’s also a UX researcher, it’s extremely important I understand the impact each feature has on the user experience and how our users interact with our platform. When we add new features, we only have assumptions on how they’ll be used, so we need to check if they are true after they’re released.
This post will describe how we get user reaction data about our platform by using these four recommended channels for product feedback and usage data gathering.
Google Analytics Usage Data
We first need to measure our platform before we can know what to improve. We’ve implemented Google Analytics tags across our platform, and each UI component fires an event for each user interaction.
Google Analytics can help us answer these questions and take appropriate action:
- What are the most common form errors users get? We are continuously analyzing top errors and taking action to resolve them.
- What are the most common UI selections? For example, by looking at the usage, you can reorder the items in a drop-down by popularity and make the UI more intuitive and easy to use.
- How long does it take to complete a task? We track the time it takes to complete tasks and the success rate and try to improve them.
- How fast is the application? How long does it take to load pages? We try to improve the page or report load time if it’s too slow.
- How many people interacted with a feature, and how often? When we add a new feature, we can measure how often people use it and adopt it.
Here’s a Google Analytics report example:
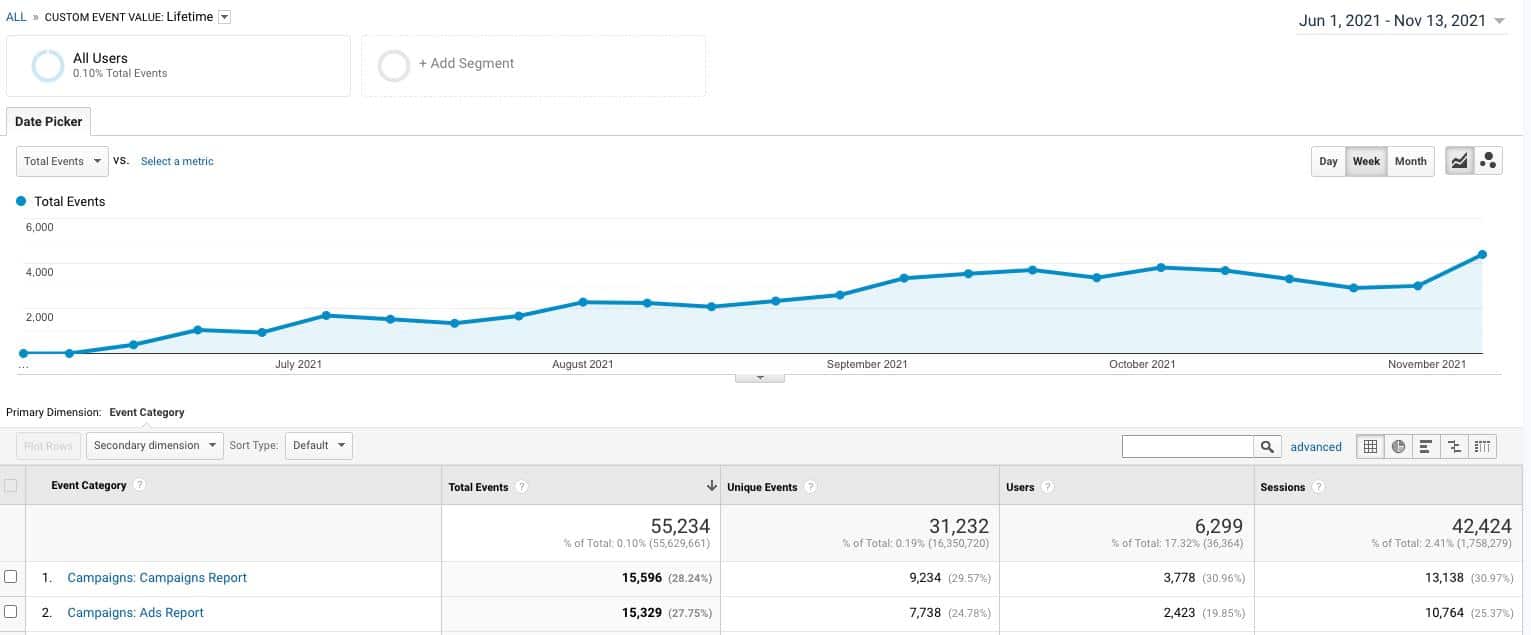
How we collect Google Analytics data
When we created our new platform, – Taboola Ads, we mapped a tracking plan with a Google Analytics expert and implemented the events into the platform code following this structure:
- Category: page name
- Action: UI component
- Label: user interaction
- Custom Event Value: what the user has selected
For example, this is what is sent when a user selects “last 30 days” in Taboola Ads:
- Category: Day Report
- Action: Date Picker
- Label: Date Preset
- Custom Event Value: Last 30 days
Implementing events across an entire application can be time-consuming for the UX and development teams, so I have a suggestion: Instead of trying to map everything in a structure that seems reasonable and makes sense, start with only the basic usage questions you have in mind. This way, you’ll avoid over-complicating things and gathering data on events that no one will ever look at. You can always add event codes later to answer more specific questions.
In-App Surveys
In-app surveys are a great way to connect with your users and involve them in improving your product. The benefit of using in-app surveys is that you’re connecting with users in the right context while they’re already using the app, giving you more valuable insights and higher response rates.
There are many tools for creating in-app surveys, such as Typeform and Momentive (formerly SurveyMonkey.) At Taboola, we use Hotjar to gather user feedback since it also has an easy-to-use survey feature.
Here are a few things to consider when surveying users:
- The first question will have the highest response rate, as there is a natural drop-off after each question, so ask your most important questions upfront.
- Instead of asking a general question, ask more specific questions about each feature separately. The answers will give you more actionable insights.
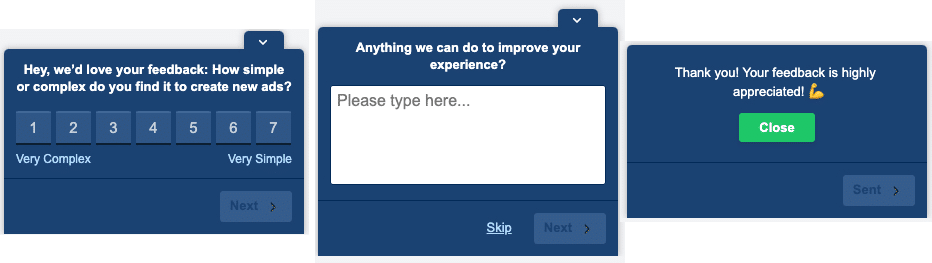
- Keep your survey as short as possible. Here are a few examples of questions we can ask:
- How satisfied or dissatisfied are you with [feature name]? Answers can range from “Extremely Satisfied” to “Extremely Dissatisfied” on a scale from 1-7.
- How simple or complex do you find it to perform [task name]? Answers can range from “Very Simple” to “Very Complex” on a scale from 1-7
- I have everything I need to create X or to do Y. Answers can range from “Strongly Agree” to “Strongly Disagree” on a scale from 1-7
It’s always good to add an open-ended question at the end, such as “Is there anything we can do to improve your experience?” or “Do you have additional feedback or ideas on improving feature X for you?
This allows people to give additional comments, suggest new ideas, or air any frustrations they might have related to this feature or product.
Open Feedback Channels
In addition to promoting surveys on-demand or pulling usage numbers, it’s also helpful to provide users with an open channel for feedback.
Internal Slack Channel If you use Slack at work, a dedicated Slack channel for the product or feature can be helpful for internal users to send questions, report bugs, ask for new feature requests, and suggest improvements. This channel can also be a way for you to communicate new releases and upgrades to people.
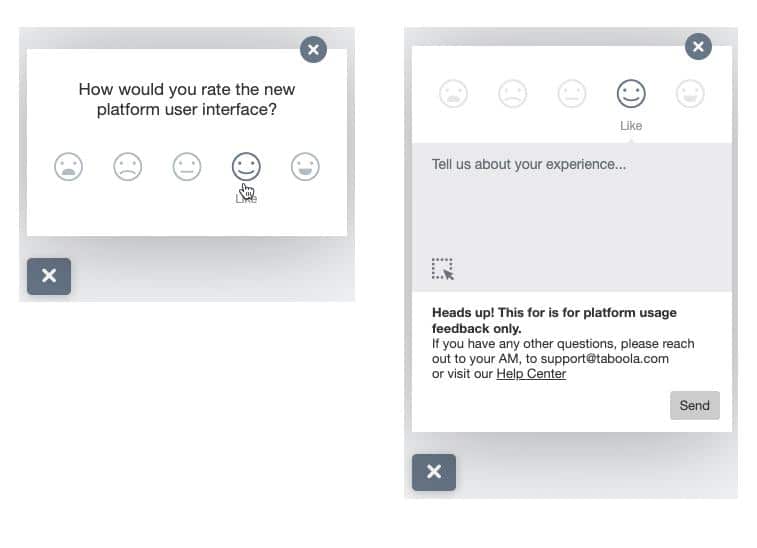
Hotjar Feedback Widget If you want to hear from external users and find out what bothers them in real-time, you can use a feedback solution on your product in production. Since we use Hotjar, we’ve implemented a Hotjar feedback widget where Taboola users can tell us their pain points, bugs, or whatever else they want to share. Users can also add their email addresses so we can reply with valuable feedback or bug reports and ask clarifying questions as needed.
Additional Channels
Besides using online analytics and surveys, there are other channels users can send their feedback.
User Interviews It’s always interesting and insightful to meet users and understand how they use your product, and learn what difficulties they have that your product can solve. We use this often at Taboola as it helps us learn about our customer’s challenges and helps us engage more with our users.
Support TicketsSupport tickets are another channel that can tell you a lot about your product. Use them to find out what product areas need improvement, what’s broken today, and what users misunderstand, so they have to contact support.
Quality Dashboards Users want fast applications, so it’s essential to monitor application speed and know how many times you’ve had downtime or slow server responses. These are more technical monitoring tools but provide another perspective to the overall user experience.
Wrapping up
A good mix of quantitative data (like Google Analytics) and qualitative data (surveys and interviews) provide a better picture of your product experience and usage. However, only looking at the numbers won’t tell us what the user experience is like. Those are important but are only one part of the overall picture.
Imagine a friend coming back from a live music concert, you ask them how it was and they replied, “It was 2.5 hours long, I danced for 32 minutes, drank two beers, and ate one hotdog. The drive home took 52 minutes. These are only the numbers, but what was it like? Did they have a good time? Can they describe it on a scale of 1 to 10? We’ll only know by speaking to them.
So, if you’re looking to collect practical data and feedback about your product, you can pull usage data, but don’t forget to ask for feedback too! And don’t forget to share it with the entire product team! Everyone will learn more about the value of the new feature you just released, whether it’s being used, and how well it’s been received.