In this blogpost I will describe how we, at Taboola, changed our metrics infrastructure twice as a result of continuous scaling in metrics volume. In the past two years, we moved from supporting 20 million metrics/min with Graphite, to 80 million metrics/min using Metrictank, and finally to a framework that will enable us to grow to over 100 million metrics/min, with Prometheus and Thanos.
The journey to scale begins
Taboola is constantly growing. Our publishers and advertisers increase exponentially, thus our data increases, leading to a constant growth in metrics volume.
We started with a basic metrics configuration of Graphite servers. We used a Graphite Reporter component to get a snapshot of metrics from MetricRegistry (a 3rd party collection of metrics belonging to dropwizard that we used) every minute, and sent them in batches to RabbitMq for the carbon-relays to consume. The carbons are part of Graphite’s backend, and are mainly responsible for writing the metrics quickly to the disk (in a hierarchical file system notation) using Whisper. Then, the Graphite web app read the metrics from Whisper, and made them available for Grafana to read and display.
This is how our primary architecture looked:
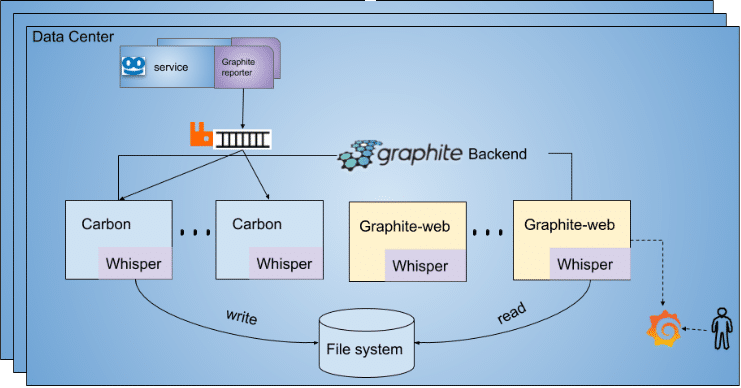
Figure 1: Graphite architecture
When we wanted to scale horizontally – we added additional Carbon, Graphite-web and Whisper DB nodes. The cluster of carbons became big and complex. In addition, we used different kinds of carbons for caching and aggregations. We started to suffer from metrics data loss, when the carbon-cache nodes crashed due to out of memory, or when the disk space (used by Whisper) ran out. Moreover, the RabbitMq cluster wasn’t well monitored, and it was complicated to maintain.
At this point, we supported 20 million metrics per minute, and we wanted more. The new requirement was: 100 million metrics per minute (!), and we knew the current architecture would not be able to scale enough to support this.
First infrastructure change: Metrictank
We chose Metrictank, because of the following reasons:
- It is C* backend – which is known to be very stable and we were experienced with it, from other data paths.
- It’s Multi-tenant – thus, we could share our content with it.
- It receives various inputs (carbon/kafka, etc.).
- It’s 100% open source.
But mainly we chose Metrictank because it’s compatible with the hierarchical Graphite syntax – thus we didn’t have to refactor our current dashboards to work with the new key-value notation.
The architecture at this time was composed of Taboola services, who reported their metrics using a new MetrictankReporter component. This reporter took a snapshot from MetricRegistry every minute, and pushed them, after batching, into a local kafka cluster.
The metrics moved to the backend aggregative kafka cluster using a KFC-Mirror component (KFC = KaFka Consumer). There, they were consumed by the KFC-Metrics consumer, unbatched and compressed to a msgpack format, and finally pushed again to the same kafka with a different topic, for Metrictank to consume.
In addition, we had external services (e.g., kafka, cassandra), who reported their metrics to carbon-relays that were used as kafka producers. They pushed their metrics into the local data center’s kafka as well. A KFC for external services consumed their metrics, batched them, and pushed them back to the local kafka, for the KFC-Mirror to transfer them to the backend cluster as well. There, they went through the same process of un-batching and compressing into msgpack.
Last, one essential service for us (Sensu, used as an alerting system) worked only with RabbitMq, thus dedicated carbon-relays consumed its metrics from Rabbit and pushed them to the local kafka.
This is how our Metrictank architecture looked:
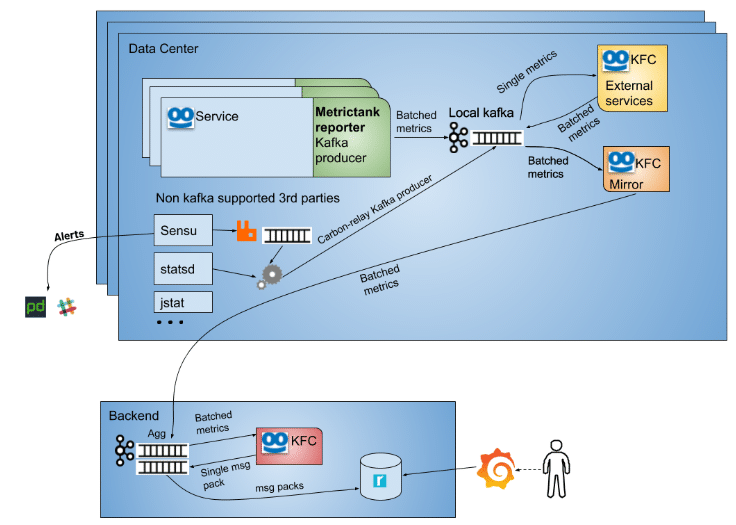
Figure 2: Metrictank architecture
We started with an architecture of 9 Metrictank VMs – 24 cores each, and 10 nodes of Cassandra. Each node saved 1-2.5 terabytes of data to the disk. After a year, our disk usage incrementation looked like this:
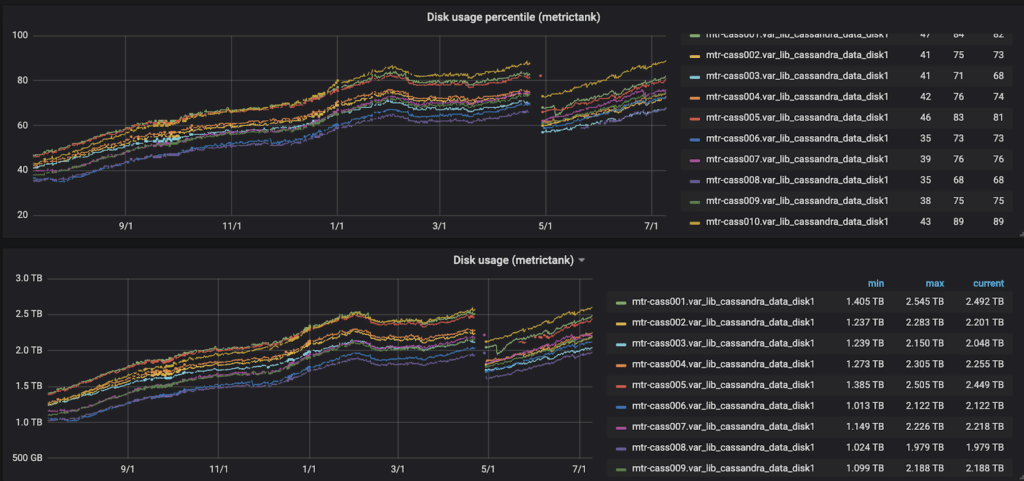
Figure 3: The increase in disk space usage in percentages of Taboola’s cassandra nodes (upper plot) and the disk usage in terabytes (lower plot)
Metrictank introduced new challenges. First, it handled the downsampling and the query module in the same service. It had to flush the metrics twice a day to perform the necessary aggregations and write them to Cassandra. This caused a performance overhead, and daily downtimes in the query side.
In addition, we suffered from kafka disk space issues, so we had to reduce their retention. Last but not least, our kafka consumers tried to overcome consuming lags, by pushing to Metrictank unproportional loads of metrics, which in return made it crash.
In order to overcome the daily downtimes, we moved our Metrictank nodes to Kubernetes, and created 25 primary nodes who were responsible for writing the metrics to Cassandra, and 25 replica nodes who were available for queries from Grafana.
We grew in the last year from 20 million metrics per minute to 80 million metrics per minute.
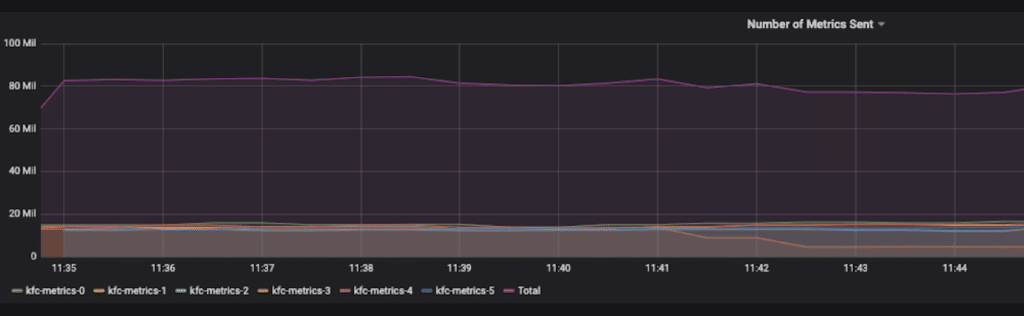
Figure 4: Taboola’s metrics amount in the Metrictank path
This new reality made us constantly request for additional storage such as Cassandra nodes and larger disks for kafka. We still had to deal with Metrictank pods crashing from time to time after consuming huge unbalanced amounts of metrics. And finally, we received a new requirement: defining metrics per publisher. Taboola has over 10,000 publishers, which meant a lot of new metrics being added to the metrics flow.
The current infrastructure could not be scaled enough to support the above, thus we decided to change it once again.
Second infrastructure change: Prometheus
Why choose Prometheus?
- It is simple to install & scale.
- It has a federation ability – every Prometheus service can turn itself to an endpoint for another Prometheus service to consume the metrics from.
- It has a built-in alert manager.
- It is widely used and maintained.
- It is 100% open source.
The major difference between our Metrictank architecture and Prometheus was that Prometheus scraped metrics from dedicated endpoints, while Metrictank consumed the metrics from kafka. Thus, our implementation had to be changed. In addition, there was one major drawback: we had to refactor all our existing dashboards to key-value notation. So, we wrote an automatic tool for converting complete Grafana dashboards from hierarchical graphite syntax to a key-value notation.
Similarly to the MetrictankReporter, we wrote a new TaboolaExporter. The exporter took a snapshot of metrics every minute and exposed them in the service’s endpoint. The Prometheus service in each data center scraped the metrics and stored them internally.
For external services such as Kafka and Cassandra we used additional exporters (mainly JMX exporters) to expose the metrics to dedicated endpoints as well.
The Prometheus service used Consul’s discovery abilities in order to know which servers to scrape the metrics from. Finally, we used Prometheus’ built-in Alert Manager for reporting local data center alerts.
This was our first vanilla deployment of prometheus in each of our data centers:
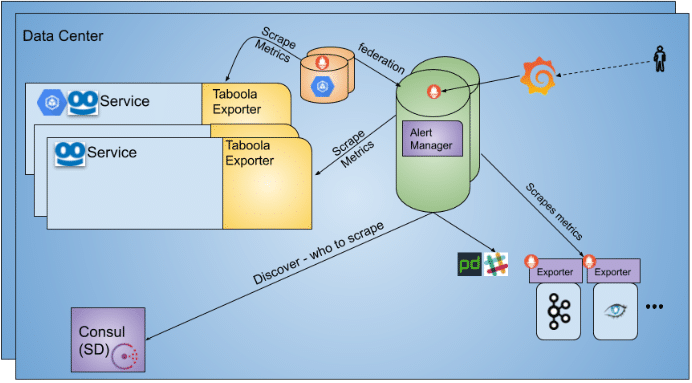
Figure 4: Taboola’s metrics amount in the Metrictank path
The above deployment worked like a charm, but we still had to answer some hard questions:
- How can we store terabytes of data in a reliable and cost-efficient way, without sacrificing our queries response times?
- Can we execute an aggregative query over all data centers, from different Prometheus services?
For this purpose, Thanos came into play. Thanos is a collection of services created specifically for using Prometheus at high scale and across data centers.
We used Thanos as follows:
- Thanos query – handled our cross data center queries, using client-side join of the data from each Prometheus db.
- Thanos ruler – recorded our heavy / frequently used queries ahead, and the results were available for the Thanos query service as a time series data to scrape.
- Thanos sidecar – used as a mediator for our long term storage that was defined for each prometheus server (e.g. Google storage).
Adding Thanos to the former deployment looked as follows:
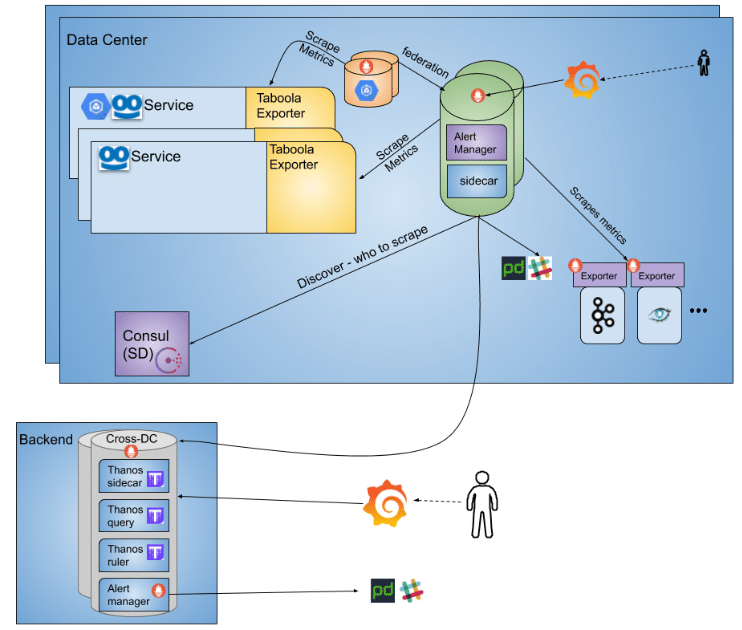
Figure 6: Adding Thanos for cross data center queries
After adding Thanos, we met the first requirement we had – to support +100 Million metrics per minute.
Finally, a success story
After deploying Prometheus and Thanos framework, we reduced the amount of metrics sent through the Metrictank path by almost half, and this flow is still functioning and stable on Kubernetes, with close to zero downtimes. Currently, we have 48 million metrics/min (800,000 metrics/sec) in the Metrictank path and 73.2 million metrics/min in the Prometheus & Thanos Path (1.2 million metrics/sec, and keeps growing).
We changed our metrics infrastructure twice in two years as a result of continuous growth in our metrics volume. We faced complex implementations and gradual deployments along the way. Remember – major changes do happen frequently in dynamic companies, and with a strong team they can lead your company to great success.
Regarding our metrics per publisher requirements – it was simple to implement after the last infrastructure change. If you are interested in how we did it, you are welcome to check out the Taboola Engineering blog, and search for our next blogpost on “Publisher Metrics and much more @Taboola”, soon to be published.
I want to thank the best Infrastructure Engineering group in Taboola who made all of this possible. Special thanks to Moty Lavi and Tidhar Klein Orbach for helping along the way.