
All Stories

The successful integration of LLMs has expanded news coverage on local publishers’ websites, akin to editors’ broader context, potentially enhancing coverage outcomes, albeit with considerations for latency and cost implications.
Optimize Data Center Health: Taboola employs LSTM Autoencoder for precise anomaly detection, enhancing system performance.
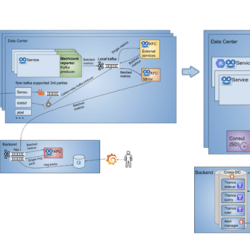
In this blogpost I will describe how we, at Taboola, changed our metrics infrastructure twice as a result of continuous scaling in metrics volume. In the past two years, we moved from supporting 20 million metrics/min with Graphite, to 80 million metrics/min using Metrictank, and finally to a framework that will enable us to grow to over 100 million metrics/min, with Prometheus and Thanos. The journey to scale begins Taboola is constantly growing. Our publishers and advertisers increase exponentially, thus our data increases, leading to a constant growth in metrics volume. We started with a basic metrics configuration of Graphite servers. We used a Graphite Reporter component to get a snapshot of metrics from MetricRegistry (a 3rd party collection of metrics belonging to dropwizard that we used) every minute, and sent them in batches to RabbitMq for the carbon-relays to consume. The carbons are part of Graphite’s backend, and are […]