I want to start by saying to all finance marketers: your digital advertising is strong—but it could be stronger.
First off, finance is one of Taboola’s strongest verticals, and it’s not just us.
According to data from eMarketer detailing digital ad spending, you’re predicted to spend $11.3 billion dollars on digital advertising in 2018, which will increase to $15.2 billion by 2021.
Not only that, your strategies are quickly expanding to include native advertising and video, according to eMarketer’s US Financial Services Industry StatPack, 2017.
Despite your strength in the market and your willingness to dive into new channels, there are a couple of areas where you could improve.
We just released a new report for the finance industry, “Global Trends in Native Advertising for Finance 2018.” Inside, we explore the full native advertising landscape for finance marketers—the market opportunity for finance content in 12 countries, tools to help you build the best performing campaigns, and behavioral insights to help you meet open web surfers when and where they want to be met.
In this report, finance includes the lot of you—this report spans mortgage lending, banking, fintech, financial services and more.
For those of you running digital campaigns on behalf of your finance-related brand, these four insights stuck out as the most important trends—without it, you could be holding back your campaign’s success.
A misunderstanding of competitors in your market.
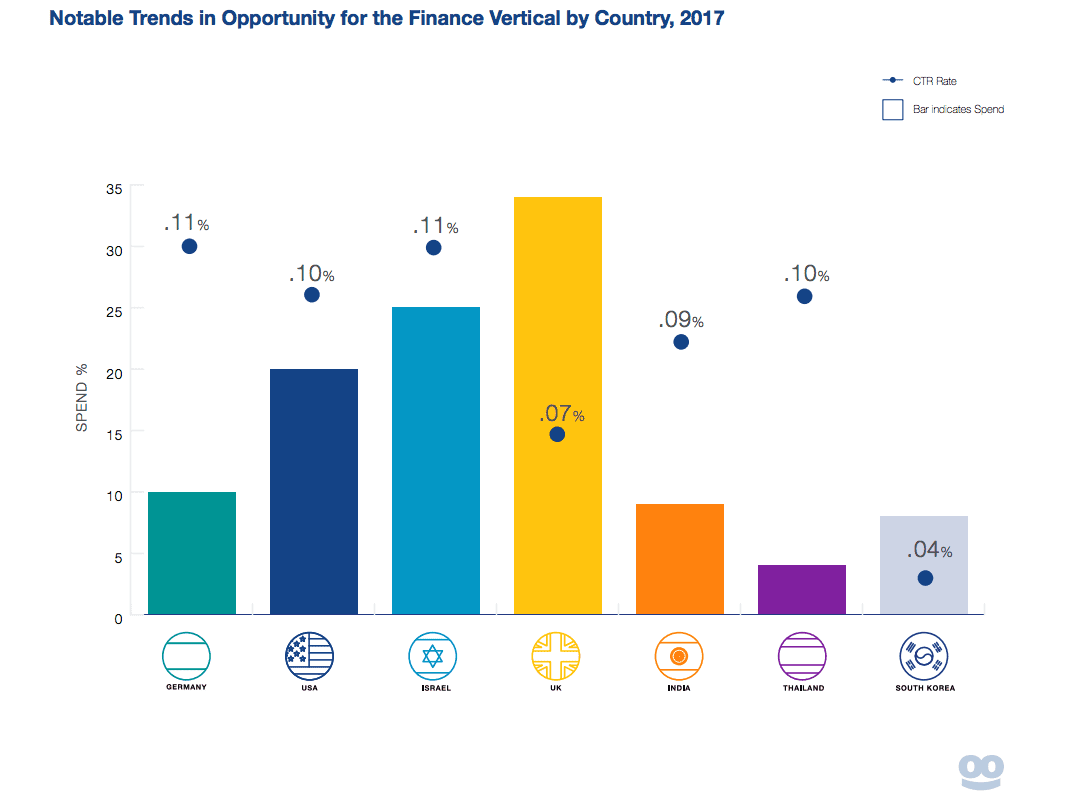
The first thing we did was take a look at supply and demand for finance content in all 12 countries of focus: Australia, Brazil, Canada, France, Germany, India, Israel, South Korea, Thailand, The United Kingdom (UK) and the United States (US).
That means we took a look at how much you and your competitors are spending to promote your content in these countries (supply), and how much people are clicking on that same content (demand).
We found that depending on where you are in the world, the market opportunity for finance content fluctuates.
In countries where supply is high and demand is low, there is massive market opportunity for finance advertisers. In the countries where supply is low and demand is high, you can expect to face more competition, and that you’ll need to ensure that you’re targeting smartly.
The most notable trends we saw were in the UK, US, Israel, India and Thailand—countries with the highest market opportunity. Also notable trends in the UK and South Korea show higher amounts of competition in these areas.

For the full breakdown of market opportunity for each of the 12 countries mentioned, download the report.
Hesitating to jump on the mobile bandwagon.
According to that same eMarketer ‘stat pack’ I mentioned before, nearly three-quarters of financial services’ digital ad spending will go to mobile in 2017.
Mobile is exploding, and most financial marketers, including some of the biggest finance brands, are racing to capitalize on the device’s growing engagement with consumers.
“We’re trying to make an impact in mobile and shift dollars there, which requires a wholesale change in how we create content,” Arianna Orpello, Senior Vice President of Brand, Acquisition and Digital Marketing at TD Bank Group told eMarketer.
For such a dominant banking brand to shift an entire content strategy for a certain device type is nothing short of a big deal. The reason for the mobile rush is performance. It just, works.
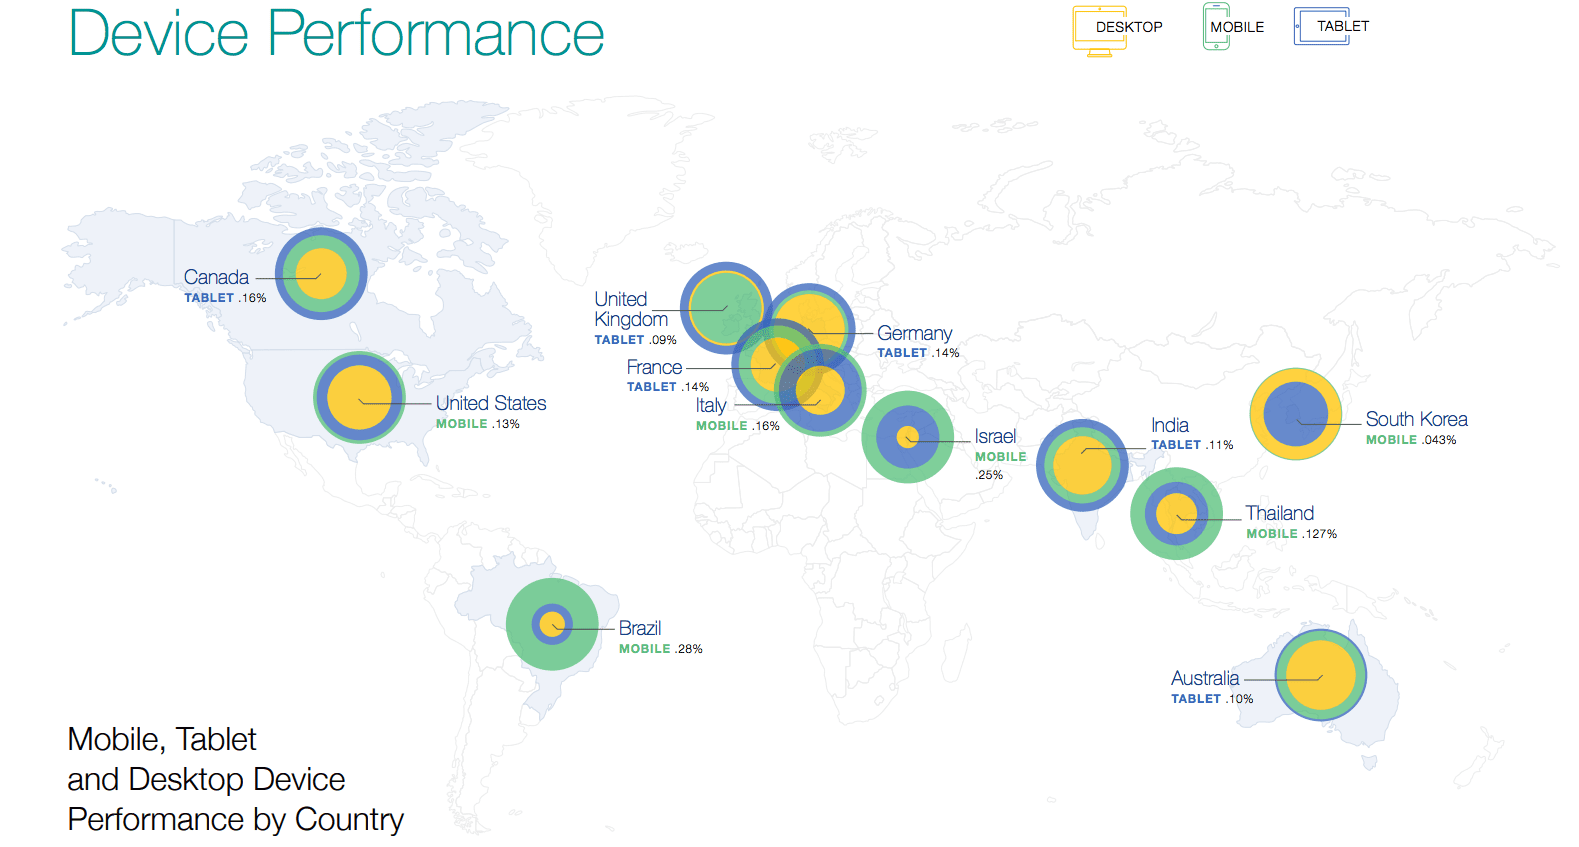
Across every country we analyzed, mobile and tablet devices took the lead in average click-through-rate (CTR).

If you’re not already, you should be testing campaigns on mobile and tablet devices—but don’t count out desktop devices just yet. Download the report for a full breakdown of CTR trends by platform.
Ineffective images and titles in your ad creatives.
When it comes to building the perfect ad creative to attract potential consumers while they’re browsing on the open web, we’ve got your back. Taboola Trends is updated with weekly insights into the types of images and keywords performing for your vertical each week.
In our report, we took a look at insights that covered image characteristics and title keywords. The finance category was different from trends we see universally, in almost every way.
These were the top insights we saw regarding images used in native advertising campaigns:
- Images without animals have a 100% higher CTR than images with animals.
- Black and white images have a 49% higher CTR than color images.
- Images with no people in them have a 30% higher CTR than images with people in them.

The full report covers insights on food, text, gender, location, distance and graphical data, as well as the top trend by country.
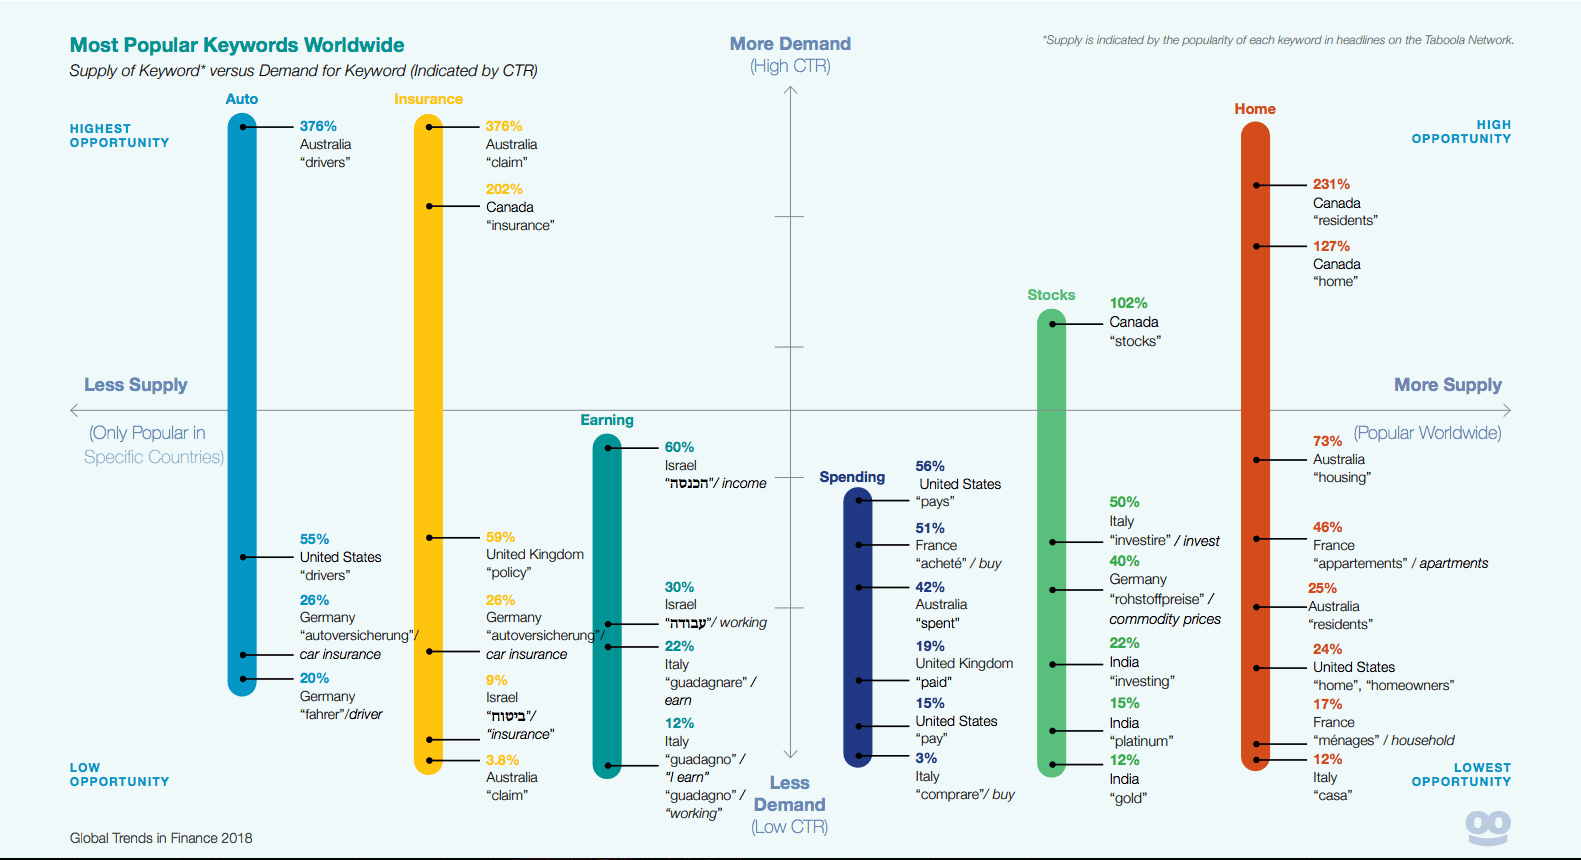
The top keywords for the finance industry were a bit less surprising. The keywords that generated the most demand in a market with the least amount of supply were:
- The keyword ‘drivers’ in Australia.
- The keyword ‘claim’ in Australia.
- The keyword ‘insurance’ in Canada.

Download the report for a full breakdown of the top ten best finance keywords by demand, by country.
Not adjusting campaigns to meet consumer behavioral patterns.
Finally, we took a look at several behavioral trends to help finance marketers improve targeting tactics for their native advertising campaigns.
What we found—the time of day when people are in the mood to just sit back and view finance content, and the time at which they’re most likely to click on finance content, isn’t the same.
For finance marketers looking to run successful performance campaigns as opposed to successful brand awareness campaigns, this information could spell a huge different in success.
For impressions, you want to target any time during the work day. The graph below shows a heat map to reflect this trend:

Clicks, however, don’t behave the same way as impressions. Download the full report to see heat maps that break down trends in clicks and CTR for each country.
Don’t get held back by misinformation on your market, hesitancy to jump on the mobile bandwagon, ineffective creates and a misalignment with consumer behavior.
For the most effective finance campaigns, take into consideration some of the trends that affected finance marketers in 2017, and are helping shape their digital outlook for 2018.