At Taboola, we work daily on improving our Deep-Learning-based content-recommendation model. We use it to suggest personalized news articles and ads to hundreds of millions users a day, so naturally we must stick to state-of-the-art deep learning modeling methods. But our job doesn’t end there – analyzing our results is a must too, and then we sometimes return to our data science roots and apply some very basic techniques.
Let’s lay such a problem out. We are investigating a deep model that behaves rather strangely: it wins over our default model for what looks like a random group of advertisers, and loses for another group. This behavior is stable in the day to day, so it looks like there might be some inherent advertisers qualities (what we’ll call – campaign features) to blame for this. You can see a typical model behavior for 4 campaigns below.
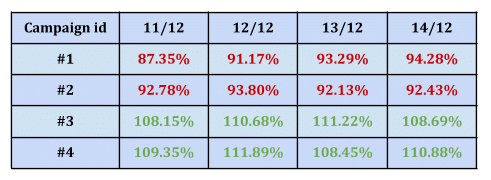
So we hypothesize that something about the campaign makes this model either work or not. Could it be the type of publishers the campaign uses? The size of their audience? Their cost per click? Maybe all of these things together? Santa is not here yet to help, so we should investigate this!
If we thought there might be a single numerical feature responsible for this, we could write a simple script in python to look for correlation between the different campaign features and our label. But we think there’s more than one campaign feature to blame, plus we have many categorical features – so we can’t simply correlate. What to do? Let’s harness the power of classical machine learning! So, we’ll use a machine learning algorithm (specifically, a decision tree) to help explaining our deep-learning model results:

Some questions you might have before we go forward:
- Why use a tree, and not just use deep learning explainability tools like SHAP? We are trying to insulate the campaign features here, and the general model uses a lot of other features that are irrelevant (user features, context features) now. Also, we might have more meta-data to use than what goes into the deep model – say, the language of the campaign, how long it’s been running etc.
- Why use a tree, and not just another deep model to figure this out? We are looking for maximum explainability, even if our model isn’t 100% accurate – as long as it points to the main suspects that make us win/lose.
- Why use a simple decision tree, and not random forests or xgboost? Just like the previous question. A decision tree is powerful enough to catch the main bad guys, it’s only a few lines of code and you can plot it!
- How do we choose the depth of the tree? Try to keep it simple, if you think you might have 1-3 leading features to find, a tree of depth 2 will suffice. You can look at depth 3 to see that you didn’t miss anything. Anything more is probably too much.
So, to recap, we generate a table with all our campaign features and add a label column with 0/1, depending whether we do better or worse than our default model (This is what we are trying to predict). Use this table to fit a tree classifier. Then plot the tree and see what it found or just look at the features sorted by their importance. Results come after only ~15 lines of code and in less time it took you to read this post.
This technique ended up being pretty useful: If there are indeed features that make a model work we can spot them almost instantly. Even more important, if the tree finds just noisy unexplainable columns – this means our hypothesis was wrong.
Some highlights before we paste the actual code below.
- Trees can work with categorical features, but you have to 1-hot encode them first. Don’t work hard and implement it yourself, but use the pandas built-in function below.
- Be careful with weird columns correlating with your label column! Remember explainability is key here – so if you suddenly find some random categorical value being very high on your decision tree, it’s probably noise! remove it and start from the top.
- No need to split the data between train and test, using a low depth should take care of overfitting for us.
That’s it. Sometimes simple solutions are sufficient even for baffling questions. Trees are fast, explainable and their plots look really nice in presentations 🙂
Merry Christmas and Happy Holidays everyone!

As promised, sample python code here:
# Imports
from sklearn.tree import DecisionTreeClassifier
from sklearn import tree
import pandas as pd

# Read the files
data = pd.read_csv("your_file_here.csv")
label = “your label column”

# Split data from label
y = data[label]
X = data.drop(label, axis=1)

# Data preprocessing:
# Fill in NaN
X = X.fillna(0)

# Turn categorical features to 1 hot encoded columns
X = pd.get_dummies(X)

# Fit tree
max_depth=2
classifier = DecisionTreeClassifier(random_state=0, max_depth=max_depth)
classifier.fit(X, y)

# Print top 5 features by importance
print("max depth:", max_depth)
print(sorted(zip(X.columns, classifier.feature_importances_), key=lambda x: x[1])[-5:])

# Plot tree
from sklearn.tree import export_graphviz
import graphviz
export_graphviz(classifier, out_file="mytree.dot",feature_names=X.columns)
with open("mytree.dot") as f:
    dot_graph = f.read()
graphviz.Source(dot_graph)