What happens when you set a goal to increase Taboola’s critical data processing path capacity, which is in dire need of more juice? You get a x2 performance boost!
In this blog post, we’ll describe how Charles from the algorithm team, Gilad – our cloudification team leader and myself from Data platform, managed to double our machine learning training pipeline throughput.
Taboola, processing hundreds of TBs of daily data, has many different data processing pipelines, where disciplines from various areas usually intervene. One such data processing pipeline, which we’ll describe in this blog, runs many intense machine learning algorithms on huge amounts of production data. This important pipeline is used to gain business insights into how Taboola’s users and sites interact with each other. Its output later translates into improving the quality of our recommendation models, the very core of our business.
In order to be able to process multiple TB of new data every hour, we make use of all types of software and hardware buzzwords, such as Kubernetes, Volcano, machine learning frameworks running on heterogeneous CPU and GPU clusters.
Improving the machine learning pipeline performance directly translates to increased throughput when training our different recommendation models. This also translates into reduced hardware costs. Another very important side effect is the fact that our algorithm team can now run and test more (and different) algorithms on the same hardware, thus improving our recommendation engine AI even further.
So, let’s dive into the technical details of how we’ve accomplished just that.
Initial performance analysis
Taboola trains many of its big TensorFlow networks on a heterogeneous on-prem GPU clusters consisting of more than one hundred P100, V100 and A100 GPUs. We’re re-training all the networks daily on real life, live, production data. Obviously this process takes a lot of time and resources.
In order to improve the cluster’s performance and optimize its work, mainly so we finish the work within the desired time frame, we decided to launch a performance analysis effort and explore the short and long term optimization opportunities we can use.
The initial performance analysis showed us that the TensorFlow networks did not take full advantage of the GPUs capabilities.
The GPUs were relatively underutilized as shown by the nvidia-smi tool. The initial load was around 30-40% during peak time. Profiling the network’s while it trained, using NVIDIA’s nvprof tool, assured us that there were some significant gaps in the timeline where the GPU was idle or not fully utilized. The empty slots in NVIDIA’s nvprof output in Figure-1 shows exactly how much percentage the GPU was idle out of the whole timeline.
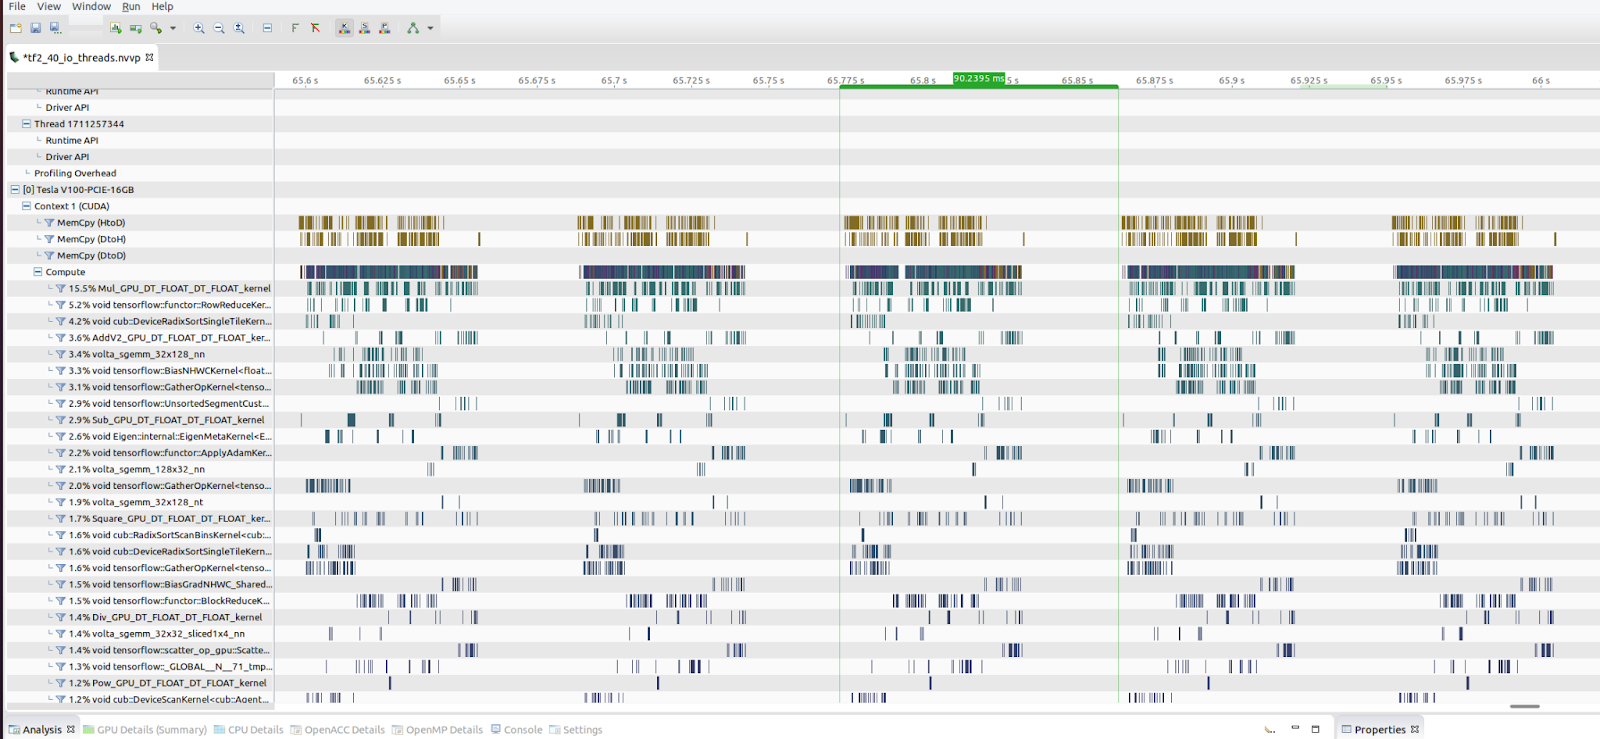
Diving a bit deeper into the code, we saw that a certain time consuming TensorFlow op was running entirely on the CPU and not on the GPU. At this point we started to look for some low hanging fruits optimizations that we could use. After all, the idea is to get as much run time within the GPU and let the CPU manage the OS, IOPs and code path.
We’ve noticed that the default TensorFlow implementation uses almost 100% of the GPU VRAM upon initialization. We started wondering whether allocating the entire GPU’s VRAM was mandatory for the network to run and whether we could squeeze two concurrent trainings at the same time on the same GPU.
It soon became clear that we could decrease the memory requirement, per trainer, to just under half of the 16 GBs installed in the P100 and V100 GPUs, using the following code fragment:

We let the various trainers run using this configuration for a few days in production to verify they run as expected, don’t crash and yield the correct algorithmic results. Once we were able to observe this is the case, we could move on to the next stage.
The next step was to launch two different networks concurrently on each GPU, each of which taking 40% of the GPU’s VRAM. This is not a “text book” solution as the two trainers will be synchronized by the NVIDIA driver and things will not really run concurrently on the GPU. However, since part of the trainer’s time is spent on fetching data from a remote HDFS server, CPU ops etc, we hoped that all these components would overlap each other and we would improve the overall throughput.
Putting it all together
Sure enough, we were able to achieve performance gains (almost double the performance) using this technique. That effectively meant that we were able to run twice the amount of work on the same number of GPUs without adding new hardware as well as meeting our production deadlines of running all the algorithm team’s networks within the needed time frame.
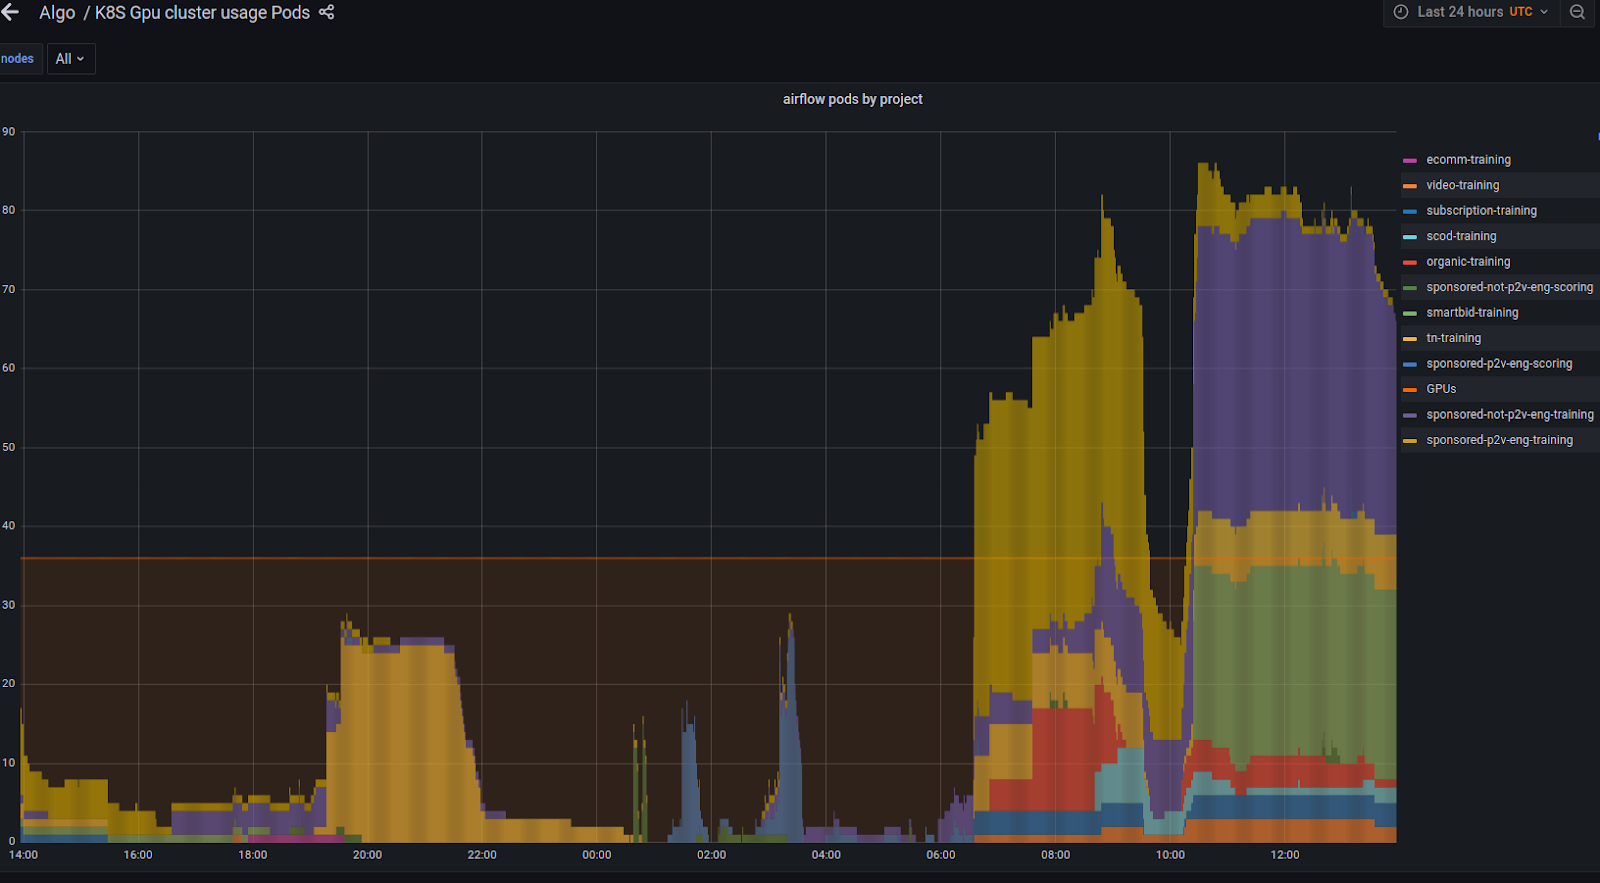
Figure-2 shows how the number of trainers increased once we opened the shared GPU feature in production. The orange horizontal line shows the actual physical number of the GPUs in the cluster. The left side of the graph shows the number of trainers running concurrently in the cluster, prior to our optimization. The right side shows the number of trainers running concurrently after the shared GPU mode was enabled. As can be seen, we were able to process twice the number of trainers on the same hardware as before.
Going forwards we plan to investigate which parts of the network ops can be further optimized and most significantly, which ones run on the CPU and can be migrated to the GPU.
Now it was time to test it in a production-like environment to test all the code and configuration changes to see if we actually gained the performance boost.
Cloudification magic
The next thing to implement was to configure the system to run as it would in production, i.e., schedule two TensorFlow networks simultaneously on the same machine. Volcano and Taboola’s cloudification team to the rescue.
Taboola uses a Kubernetes cluster to manage a significant part of our CPU and GPU servers. The algorithm’s team ML training takes place on the various Kubernetes jobs. The Kubernetes job controller creates a TensorFlow pod that is scheduled based on an allocatable GPU to a node.
When we started looking at options for implementing the scheduling of two pods running concurrently on the same physical machine and GPU, we realized we needed some extra management layer to enable us to do so.
There were a couple of available open-source tools to allow just that. The first tool we looked at was Volcano, a cloud-native batch scheduling system for compute-intensive workloads. The other option we considered was Alibaba’s device plugin and Nvidia device plugin with the CUDA Time-Slicing feature. After a quick evaluation process, we decided to go with Volcano. Volcano allowed us to implement GPU memory-based scheduling differently than the standard GPU compute based scheduling approach. The Volcano project was accepted to CNCF on April 9, 2020 and is at the Incubating project maturity level. It also supports popular computing frameworks such as TensorFlow and Spark, two technologies we heavily use, and this seemed to be a reasonable choice.
The scheduling of two concurrent processes on the same physical machine and GPU is based on the GPU’s memory size. Since we discovered that about 40% of the 16GB of the GPU’s RAM was sufficient for a single standard trainer, we based the scheduling on this parameter, allowing us the flexibility to allocate a larger portion of memory to “heavier” models and schedule them alongside smaller memory usage models. So the total GPU device utilization will be higher.We use the Volcano environment variable to calculate the TensorFlow 1 memory fraction configuration or set the TensorFlow 2 virtual device memory configuration:

One of the implementation issues we encounter in the process is with MIG (Multi instance GPU) enabled GPUs like the Nvidia A100.The GPU device plugins expose the resource to Kubernetes and assigns the GPU to the container based on the device index. In MIG enabled GPUs, all MIG instances share the same index of the physical GPU device. We tuned the Volcano device plugin to use the GPU and the MIG instance UUID as the unique identifier. Taboola pushed forward this effort and created this pull request which is still a work in progress, but it’s stable in a large production environment for quite a long time.
Figure-3 shows a typical yaml configuration file that uses Volcano to achieve our goal.

In the future, we are looking into Volcano queuing mechanisms to better support backfilling workloads like large hyperparameter tuning jobs.
Final thoughts
Taboola is processing huge amounts of data every hour, multiple TB of data, and this obviously requires a complex and efficient pipeline to process all this data. One of these pipelines is running our ML models over and over to enable us to better understand what to display to the users at each specific point of time and site.
We run our ML models using a complex software and hardware environment including over 100 NVIDIA GPUs orchestrated by kubernetes, Volcano, Dockers, TensorFlow and other software components. In order to squeeze more juice out of these pipelines, we went on to optimize the GPU usage, after identifying they are underperforming.
Our efforts paid off and we reached a very nice x2 in throughput using the same hardware. We effectively gained x2 the number of GPUs for “free”.
Our longer term goals are to further squeeze the ecosystem’s performance by, for example, optimizing our ML pipeline, migrating to Keras, exploring migrating CPU ML components to the GPU and exploring improving I/O operations as well.