In some fields, data and analytics are cut and dried. Data is consistently correct, reliable, and in easy-to-find channels. In digital marketing, this isn’t typically the case.
In addition to a variety of data holes or unavailable data, there’s the all-too-common challenges—doubt in the data’s accuracy, conflicting channels from which data is pulled, and manual labor required to pull certain datasets. It can feel like a major uphill battle trying to organize data and actually make informed decisions.
It’s these very challenges that led us to partner with Supermetrics, the leading reporting automation tool for PPC, SEO, social, and web analytics. Supermetrics removes the manual labor (read: human error) from data collection, and allows marketers to gather, compare, and analyze data all in one place.
To show Supermetrics in action and give a sense of how it could work for your team, I’ll run through how Taboola uses the new connector and the Google Data Studio engine to combine data from both Taboola Backstage and Google Analytics for our internal dashboarding and campaign optimization.
How Supermetrics works
Step 1: Use Supermetrics for Google Sheets to create the scheduled report.
We have two tables––one for our website and landing page data that’s been exported from Google Analytics, and one with data that’s been exported from Taboola Backstage with our campaigns performance data.
The goal is to have our data cleaner and our tables lighter, and scheduled reports will allow the data to update automatically.
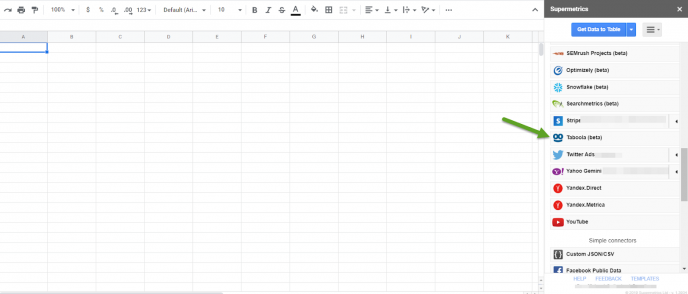
So, we first create a new Google spreadsheet, launch Supermetrics, and click on the new Taboola connector:
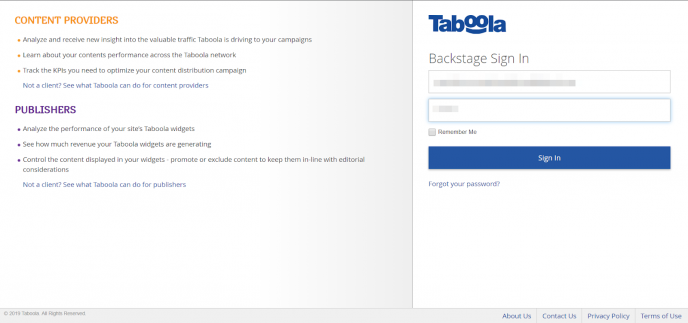
This opens the Taboola Backstage authentication page, where we fill in account credentials, sign in, and we’re all paired.
Step 2: Create the scheduled Backstage report
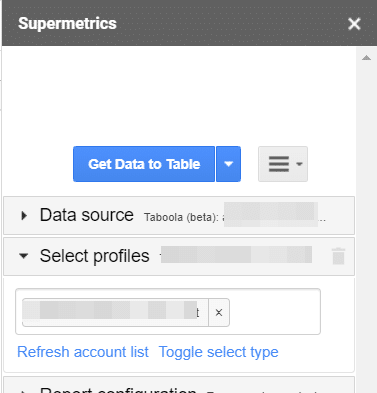
Click the Taboola connector once again, and choose the Backstage account we want to export under the select profile tab (you can choose more than one).
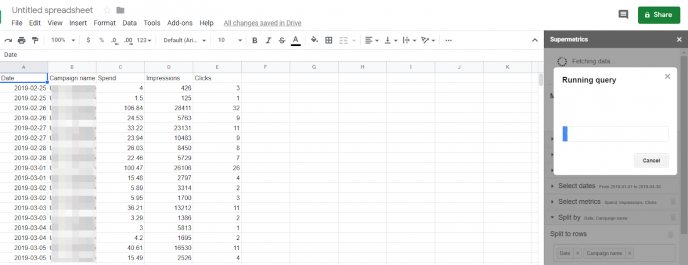
Then, we set a desired timeframe and choose clicks, impressions, and spend as metrics. Then, we choose the ‘split by rows’ option for date and campaign name.
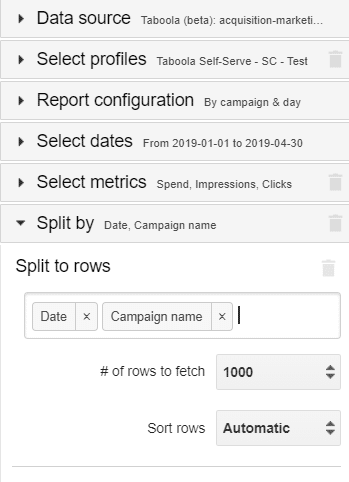
Next, we create the call, and the results look like this:
Step 4: Use the Google Analytics connector for Supermetrics
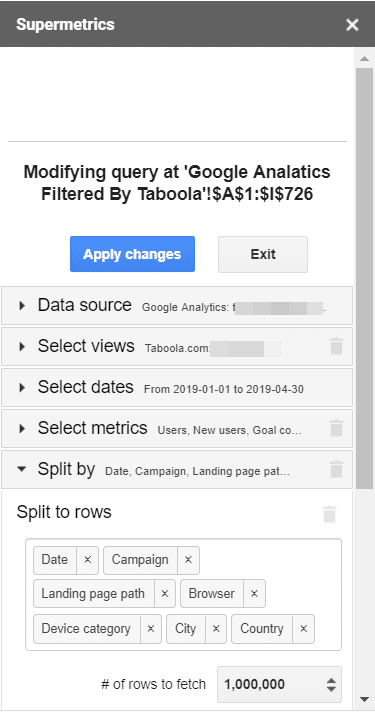
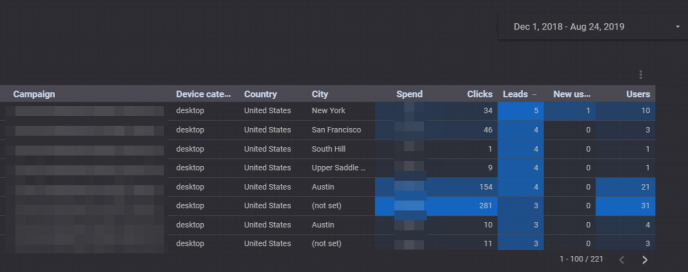
We click the Google Analytics connector login to our Google Analytics account, choose our desired Google Analytics view, timeframe & metrics.
Here, I chose users, new users, and our two main goals for this activity.
We also select the other Google Analytics dimension we’d like to explore.
Here, I chose browser, device, city, country, and landing page. It’s important to split the data into rows by date and campaign, and filter by ‘source equals Taboola’ and create the call.
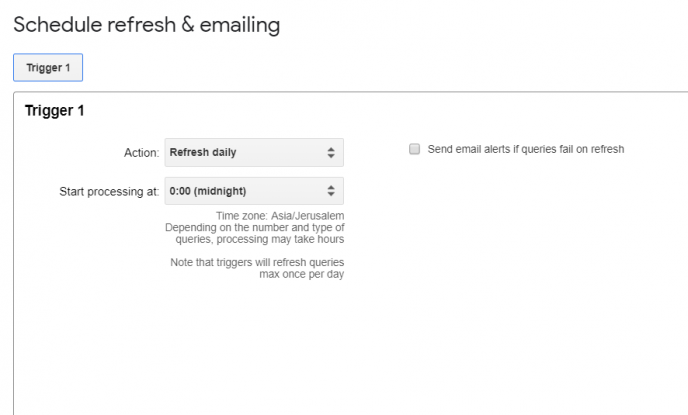
Now, our two datasets are ready. From here, we make sure it’s scheduled, and create a trigger by choosing ‘scheduled reports’, and emailing in the Google Sheets Supermetrics add-on menu. Scheduled refreshes should be created for both queries.
Integrating With Google Data Studio
So, now that we have our granulated data in spreadsheets, we want to make it easier to analyze and combine the two different datasets.
For this, we use Google Data Studio and its Google Sheets connector. Beyond the fact that this tool is so powerful, it also supports many platforms and allows us to blend and visualize data.
Users can also use a Taboola connector for Google Data Studio to port data directly into the platform.
Step 1: sign in to create a blank report and a new data source.
We choose Google Sheets and select the worksheets we just created for both of the sheets.
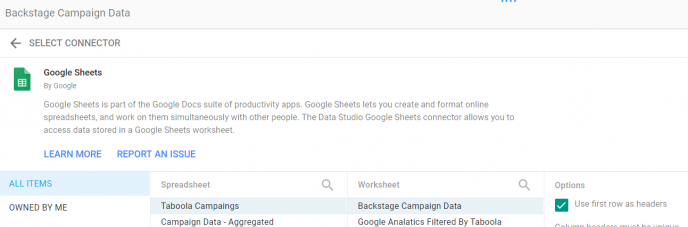
At this point, we have a Google Data Studio blank report connected to our two data sources, Google Analytics and Taboola Backstage sheet.
Step 2: use Google Data Studio’s blending feature.
We create a table, choose ‘blend data,’ join our tables by the date and campaign name keys, and add the metrics and dimension we’d like to use.
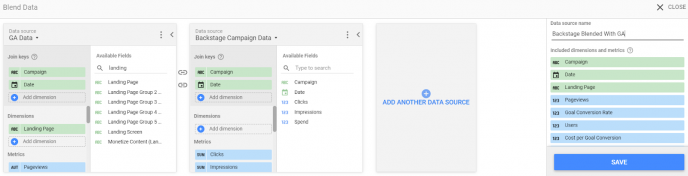
Next, we test it to make sure our data actually blends:
Step 3: visualizing the data.
This part is subjective, and really depends on business goals and the dashboard owner’s needs.
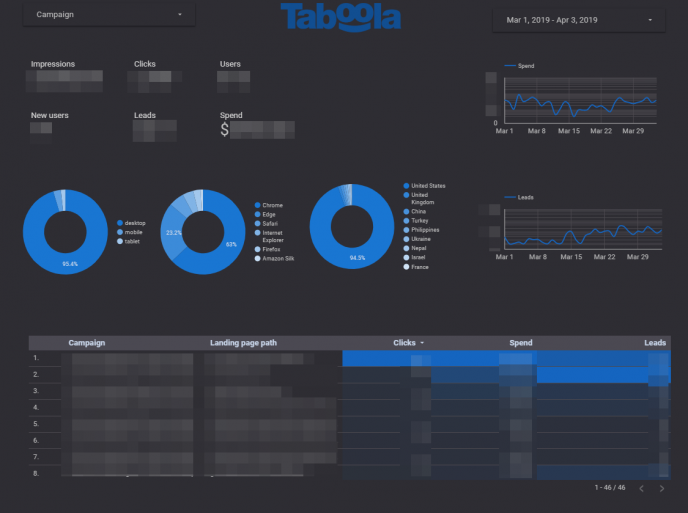
My two cents are that the most optimal dashboards are fast, easy to understand, immediately answer the most important questions, and allow users to drill down and explore easily if needed.
We try to stay creative, and interview the owner for optimal results. Here’s what our Taboola campaign dashboard looks like:
Wrapping Up
With Supermetrics, we’re able to have a much cleaner data collection and analysis process. We can feel confident in the data that’s being pulled, and eliminate the roadblocks we’ve experienced with data in the past.
Simply put, it’s the perfect digital marketing analytics tool for our team, and we feel confident that it’ll be the same for you.
Every one of our Taboola Marketing Partners, including Supermetrics, is brought on to help you (and us!) get the most out of your Taboola Campaigns. If we didn’t use it ourselves, we wouldn’t recommend it to you.