With more than 500,000 recommendations per second, Taboola is the world’s leading native advertising platform in the world. When it comes to recommending content, choosing the right features can make a huge impact.
Taboola is working with many publishers, e.g., news, shopping, sports websites, etc. The most basic feature to represent a publisher could be its identifier. Using basic features like publisher-id doesn’t tell us much about what are the user‘s preferences. Furthermore, the sparsity of a feature such as publisher-id requires a lot of data to achieve good results.
Lastly, identifier based features are prone to the cold-start phenomena, in which newly added publishers do not appear in the dataset, and are not familiar to the model yet, and more importantly, they don’t have enough traffic yet for the model to extract other meaningful features.
A better approach is to use features that characterize publishers by their articles (i.e., news items) and the users that visit them. Helping the model to better understand the publisher and select a more personalized content effectively, and enhancing user engagement and satisfaction, while improving our models’ performance and generalization.
In this blog I will describe the process of data analysis for extraction of meaningful publisher-related features for better CTR prediction.
Getting Cozy with Your Data
This journey begins with a main dataset containing information about items recommended by Taboola with information about user and publisher, over the first week of 2024.
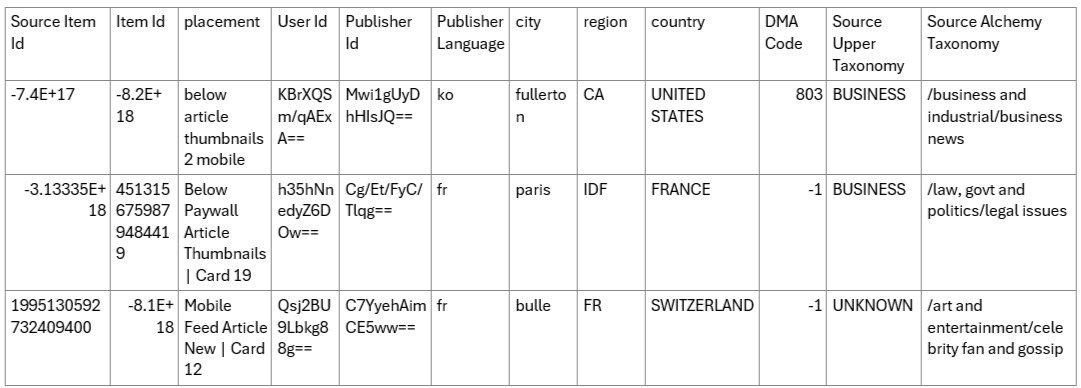
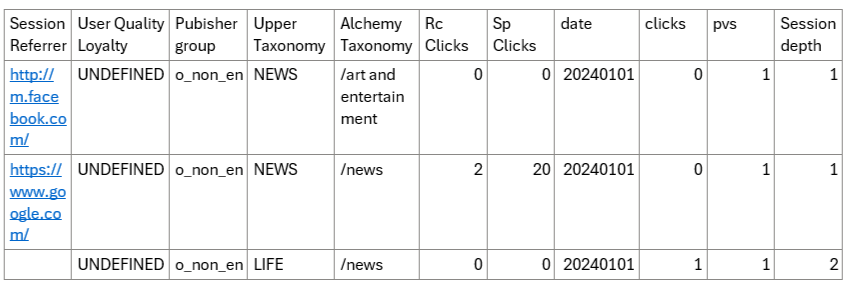
Table 1: Example of our main dataset from the 1st day of 2024.
The current dataset contains information such as:
- Placement: The name of the section where the recommended item appeared within the page.
- Session Referrer: The domain of the website that has referred the user to the publisher in the current session.
- Organic Clicks: Amount of user historical organic clicks (i.e., articles clicks).
- Sponsored Clicks: Amount of user historical sponsored clicks (i.e., ads clicks).
- Pvs: Amount of page views of the current itemId.
- Session Depth- number of pages the user passed through until he/she got to the current page view.
- Clicks: 0/1 for user click/no-click on the item.
- Source/ Target Upper/Alchemy Taxonomy – The category the article belongs to (i.e., Sports). Source is the current article, Target is the recommended article by taboola.
In addition, I used another complementary dataset for “publisher_common_features”. This dataset provides information about each publisher’s top five common user geolocations, such as country, city, region, and DMA code (for US publishers), and the five most common categories / taxonomies read by the users in that publisher (i.e., sports, entertainment, etc.).

Table 2: Example of our complementary data set.
Sampling Snacks from the Dataset Buffet
First, I filtered the main dataset to retain only samples from users that appeared in more than one of the days in the week, and had rc/sp clicks values. On top of this, I sampled only 250K samples from every week day.
Once we have a data frame ready we can start handling missing values and remove outliers.
Borrowing Data from the Neighbors’ Yard
As you can see in the snippet above, there are some missing values in the Country and Region columns, and a significant number of missing values in the Session Referrer column, we will handle these two differently.
For the Country and Region, which are both user features, we can infer some of the values by finding the userId in another sample of the dataset and set the Country and Region from that sample to the missing values one. After applying this technique, we had a very small number of missing values, so we could drop those samples.
With the Session Referrer feature, the case is different. The missing value in this column, points out that there is no information about the referral of this session, and we can simply set the value in those samples to “OTHER”.
Good Bye Long Tail!
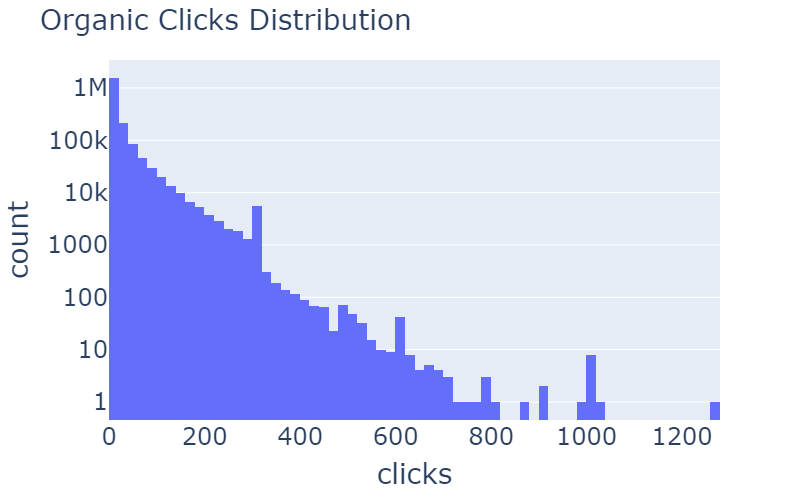
When working with a dataset that is collected based on user sessions online, it is important to remove outliers, for these outliers are mostly bots with no intention of clicking suggested content.
| Sponsored Clicks | Organic Clicks | |
| Before Removal | 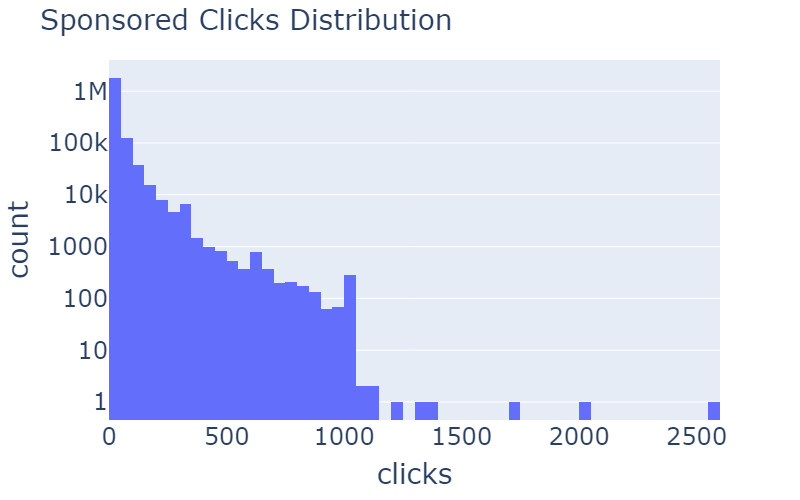 |
 |
| After Removal | 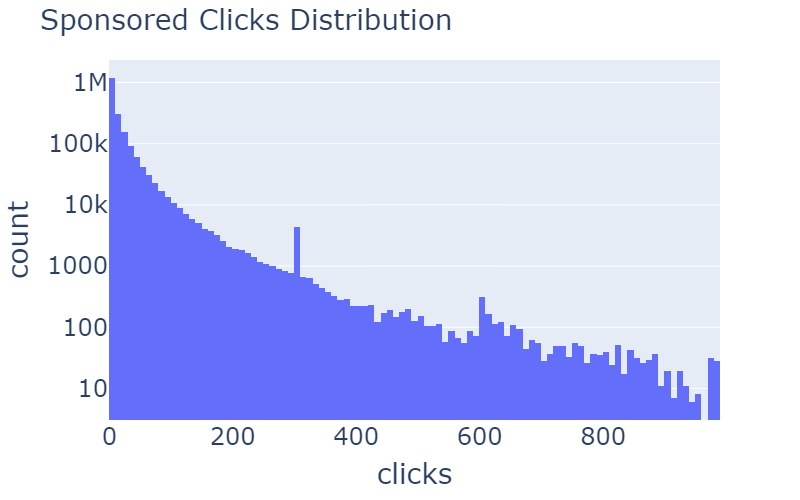 |
|
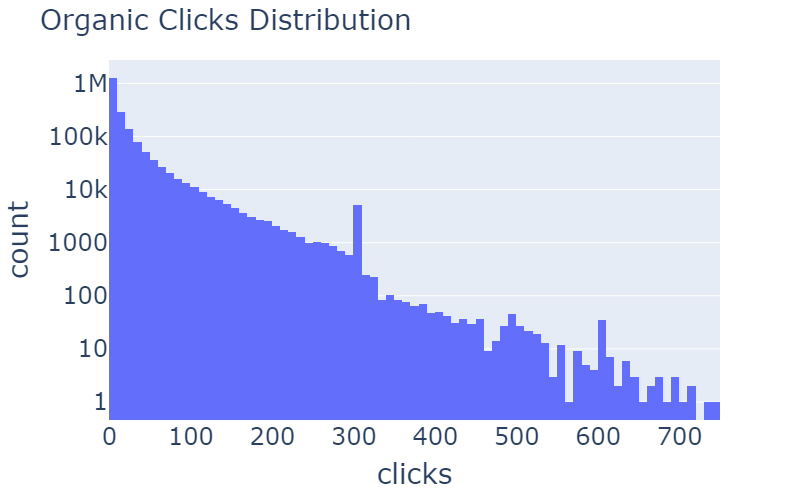
Table 3: Distribution of rcClicks and spClicks before and after the removal of outliers.
In table 3, you can see examples of anomaly removals. In the distribution of rcClicks and spClicks there are long tails that can be removed. By using z score of more than 20, we got this nice and gradual log-normal distributed curve.
Unearthing Hidden Gems in the Data Mine
As mentioned before, we want to extract some meaningful features describing our publishers.
We start by analyzing which properties of an item recommendation are likely to have influence on the behavior of the user (i.e., clicks).
One hypothesis was that some impact can come from the following features:
- is_weekend*: Binary feature for weekend sessions.
- upper_taxonomy_match*: 0/1 for match between the source and target upper taxonomy**.
- alchemy_taxonomy_match*: 0/1 for the match between the source and target alchemy taxonomy.
- in_market: Calculated as 0/1 for a match between the user’s location such as: country, region, city and DMA code
- is_sp_lover/is_rc_lover: if the user had more than 40% rcClicks and spClicks he was considered as sp/rc lovers (i.e., sponsored or organic clicker).
- is_sp/rc_lovers_publisher: 1 for publishers with more than 50% of the users being sp/rc lovers, 0 otherwise.
- is_TAXONOMY_publisher: For each TAXONOMY (i.e., article category) we added a binary feature if the TAXONOMY is one of the top 5 common upper taxonomies of the source page
- common_target_taxonomy: If the traffic that was explained by the users for this taxonomy (i.e., sports) of this publisher was more that 70%, the publisher was considered as this “taxonomy” publisher. otherwise- “None”.
*For our purpose these features will be used as calibration/ context features
**Taxonomy is a way of classifying items into groups with common characteristics. In our case, it will be the item/ publisher’s main topics (e.g. news, sports, etc…). Upper taxonomy refers to high level categories, and alchemy refers to more detailed and specific categories.
How Publishers Found Their Soulmates
In order to get some knowledge about how meaningful our features are, we will first use visualizations of our data to see which features show separation in the publishers’ data.
After performing one-hot encoding to the categorical features, and scaling the numerical features with Min-Max scaler, we used 2D and 3D PCA for visualizing the distribution of publishers.
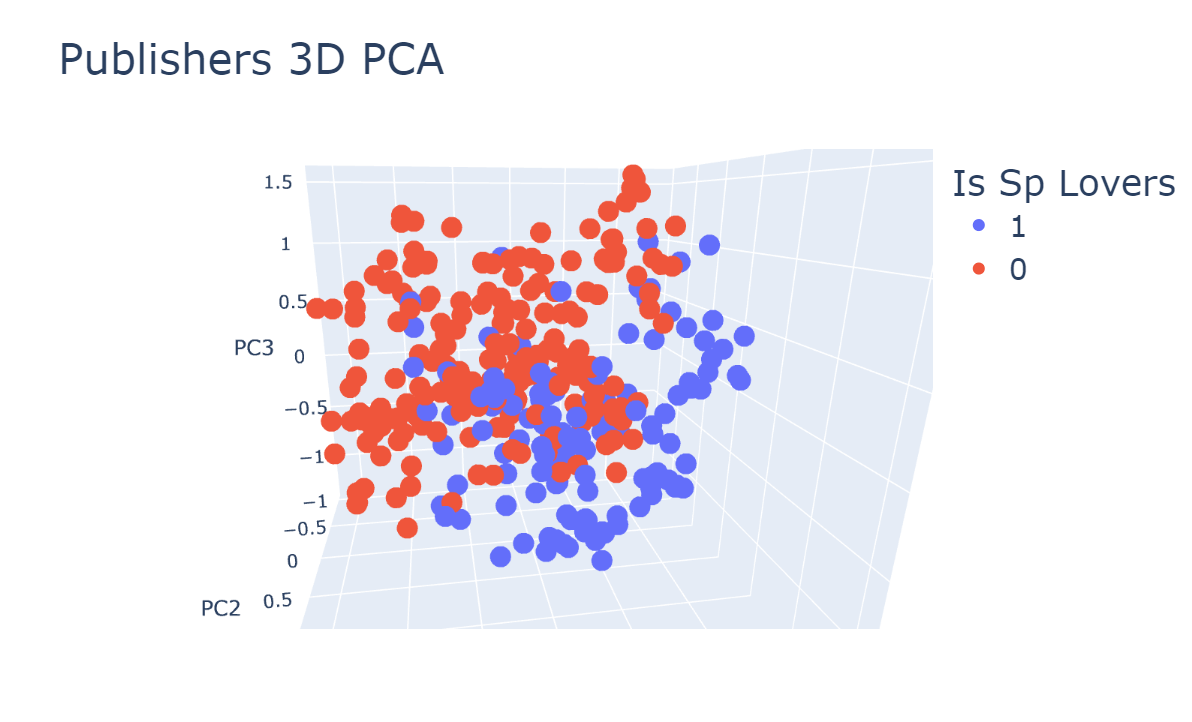
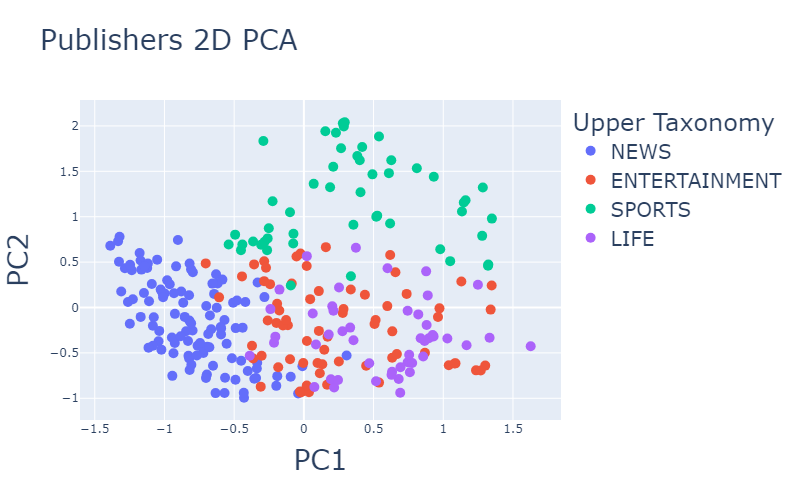
Figure 1: Distribution of publishers representation in 2 and 3 dimensions using PCA.
Here we can already see some separation with accordance to the publisher taxonomy and
whether it is a sponsored lovers publisher.
Since the existing publishers’ features do not necessarily define which publishers are similar in the context of CTR prediction, I decided to try representing the publishers using different methods that may better fit our target.
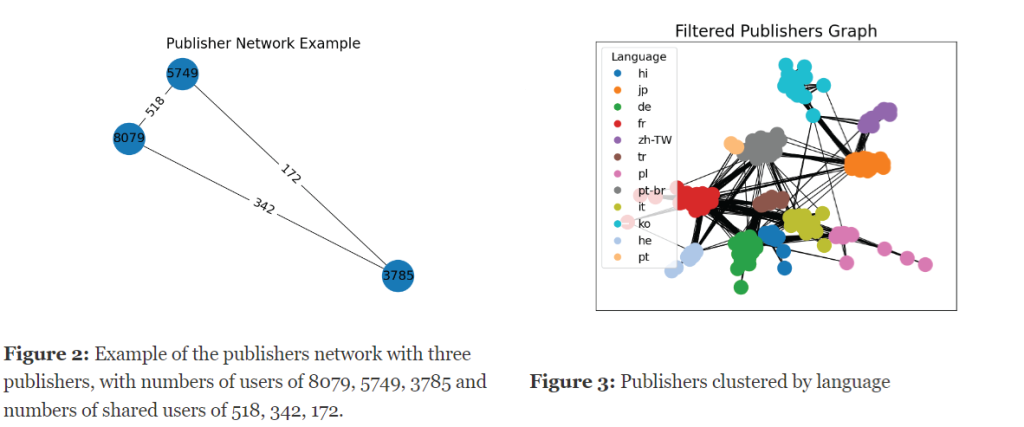
Sharing Users Like Secret Handshakes
As part of our efforts to partition our publishers effectively, we decided to represent our data as a network graph. In this graph, nodes represent publishers, and weighted edges between two nodes represent the number of shared users between the two respective publishers (see example in Figure 2).
Through this approach, we aim to find patterns and insights of why certain publishers are grouped together within the network.
There are some very good techniques to get a partition of nodes in a network. We used the Louvain-method for community detection.
In order to avoid isolated or disconnected nodes and ensure a cohesive network structure, we removed publishers with low connectivity to the rest of the network.
After analyzing the partition, it turned out that the feature that defined this clustering is the publisher language, which is an existing feature in our dataset.
Aiming at the relevant task – CTR Prediction
I used one of the known ctr prediction models, DeepFM (Guo, H., Tang, R., et al., 2017) from DeepCTR package. This model utilizes factorization machines, as well as deep neural networks to predict item click/non-click based on sparse and dense features.
During this process, every categorical feature value is mapped to an embedding space of predefined size.
After training the model with our data, I extracted the embeddings of our items and examined their clustering via t-SNE.
With this embedded space representation of our publishers, I expected that the new publisher features will:
- Cluster the items in a different manner.
- Improve CTR prediction.
Here is an example of how the publishers are distributed in the newly trained embedding space:
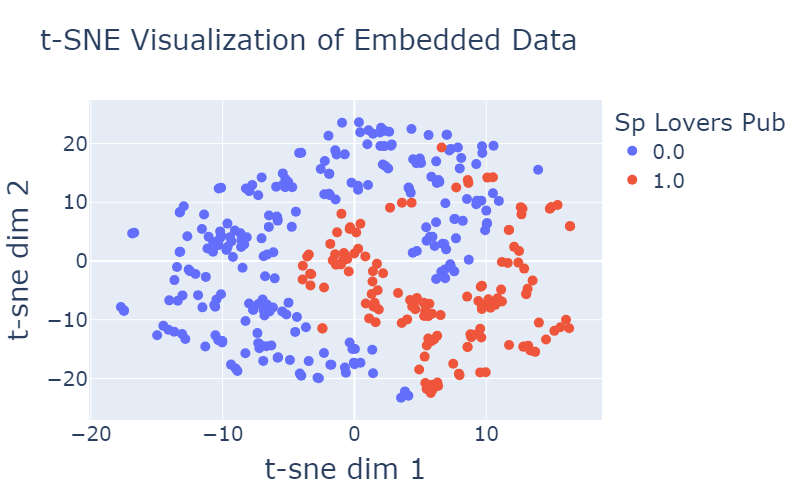
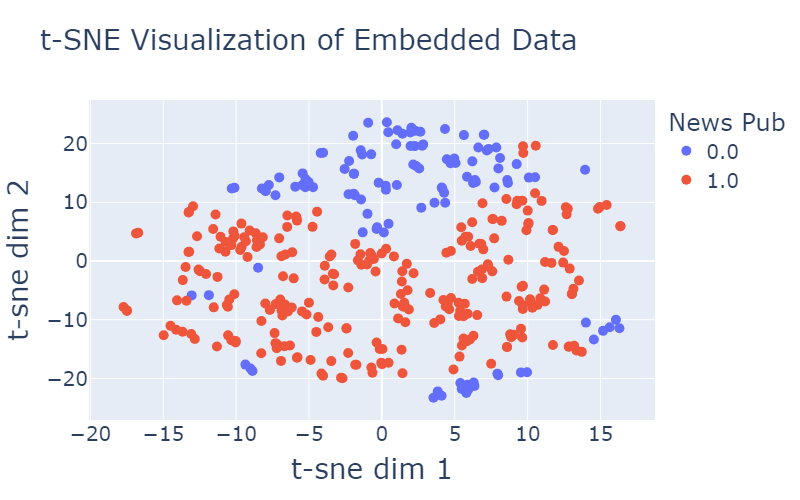

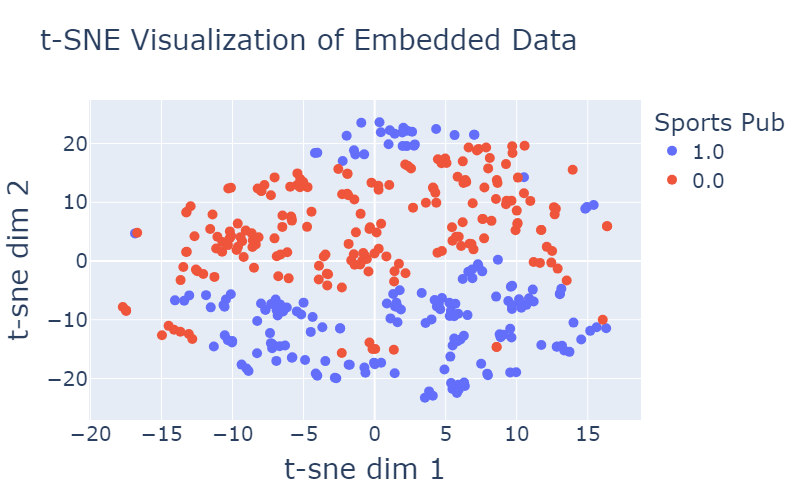
Figure 4: Illustrating the distribution of publishers in the embedding space. Each point represents a publisher, with its position determined by t-SNE. The plot is color-coded to highlight different features of publishers, such as taxonomy like news or sports and whether large portion their users are sponsored content clickers.
As demonstrated in the visualization provided in Figure 4, we observe a clear separation among the data points, in some features (e.g., Sports, News, SP lovers) more than others (e.g., Entertainment), indicating the effectiveness of the meaningful features incorporated into our representation. This separation is a testament to the significance of the features we have included, which capture essential aspects of the data and contribute to its distinct clustering.
The Moment of Truth
To validate my hypothesis, I’ve conducted a comparative analysis between the outcomes of the original model, trained on the original dataset, and those of a modified model trained exclusively on data associated with a specific cluster. Ensuring fairness, all models were trained and tested on an equal number of samples.
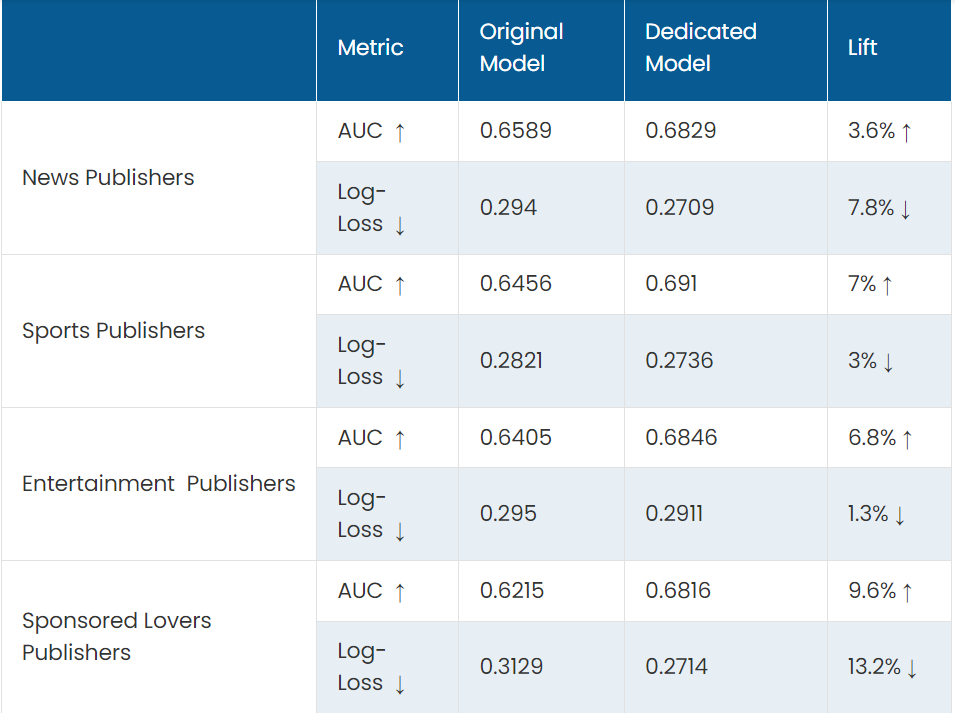
As we expected, the models that were trained and tested with only samples from a well defined cluster, performed significantly better than the one that was trained on the unclustered data.
Separation with Style
One valid suggestion that can be derived from the results in table 4 is to separate the training dataset into dedicated groups of publishers per common category. This can benefit the model, and will eventually lead to better tailored recommendations.
Wrapping It Up: The Part Where We Say: “Bye and Thanks for All the Data!”
In my journey to improve content recommendations, I inspected a data-driven clustering approach, in order to find meaningful publisher features in Taboola’s network. I analyzed user interactions, locations, and content types to find subtle clues that could boost recommendations and keep our users engaged. We discovered interesting patterns among publishers. This opens up exciting possibilities for generating more personalized recommendations.
To this end, we obtained an actual improvement in our models’ performance, with notable enhancements observed in key metrics such as AUC and log-loss. These positive outcomes validate the efficacy of our approach and reinforce our confidence in the potential of data-driven clustering to improve content recommendations.
Acknowledgments
This blogpost was created by Ofri Tirosh, and mentored by Taboola mentors Gali Katz and Dorian Yitzhach as part of the Starship Internship Program together with the Software and Information System Engineering Department at Ben-Gurion University.
References
Guo, H., Tang, R., Ye, Y., Li, Z., & He, X. (2017). DeepFM: a factorization-machine based neural network for CTR prediction. arXiv preprint arXiv:1703.04247.