If there was a way to make any of my applications ANR proof, I would do it. They (ANRs) always seem to sneak up on you and the problem is that you have nothing you can do about them. You might see them pop up when seeing the overview of your application in Google Play Console. But there won’t be a lot of information there to understand how the ANR happened and what you could do to fix the situation. Furthermore, if a user happens to experience an ANR, you have to rely on their willingness to invest time and effort to tell you about it. And we have all been on the other side. If you happen to be using an application that gets stuck, the one thing you do is go straight to uninstalling it.
So, how can we as developers, do everything in our power to protect the users of our applications from experiencing ANRs?
Let’s find out.
Be Proactive
Before we delve into solutions that can help us detect ANRs, let’s understand what we can do to avoid getting them in the first place (or minimizing the chance they can happen). These points might sound obvious, but in a large enough application, it might be easy to overlook things:
- Check to see if you have places in your code that are doing extensive work on the UI thread. The work done on the UI thread should be short and relating to something to do with the UI of your application. If you are doing any other logic there or perhaps even asynchronous work, delegate it to a background thread or a service
- If by any chance you have threads that hold locks or certain blocks of code that need to be synchronized, make sure you are not creating a deadlock or a certain state of your application reaches it
- If your application deals with broadcast receivers, you must verify that the execution of the onReceive method is short and ends in a timely fashion. If there is work there that can take some time, delegate it to a background thread
Another way that you can detect places that might cause ANRs is by using StrictMode. You can use it while developing your application as it catches accidental disk or network usage on the main thread.
Be Smart
You have gone over your application, you think it isn’t at risk for any ANRs and so you release it for public consumption. Lo and behold a couple months go by and then you start seeing reports of ANRs. What could you have done differently? As we said earlier, those crash reports hardly provide any information regarding the ANR.
To allow your application to give you the most amount of detail that it can when an ANR occurs, I will detail two options:
- Run a thread which polls the UI thread to see if it is stuck
- On API level ≥ 30, you can use getHistoricalProcessExitReasons
There is already a library called ANR-Watchdog which takes care of detecting ANRs and providing you with all the details. In case you don’t want to use it or want to have something of your own, here is a rough outline of what it does:
- Create a thread which runs on the main thread (it doesn’t have to do any actual work)
- See if the thread’s execution is completed after a few seconds
- If it did, then no ANR took place and you run the thread again
- If it did not, some other thread is blocking the main thread and causing an ANR
Below is a rough outline of such a class:
⚠️ The execution of the runnable is always on the main thread, but since it doesn’t do any work, it is not supposed to impact your application’s performance. You could also decide to run it every desired time interval
Option #2 can make your life simpler as its API gives you a lot of information.
Introduced in Android 11 (API level 30), getHistoricalProcessExitReasons, does exactly what you think it does. It returns a list of recorded objects that account for the most recent application terminations. This method is called on the ActivityManager and accepts three arguments:
- The package name – of String type (can be null)
- The process’s id that belonged to the package – of int type
- The maximum amount of reasons you want to get back – of int type
It’s important to note that all of these arguments can be substituted with default values. I.E., you can pass null as the package name and get the entire exit reasons for the caller’s UID
So what do these recorded objects contain? Well, these objects are of ApplicationExitInfo type and they can provide you with a lot of useful information. For starters, you could call the getReason method to find out why the process terminated. This method returns an integer marking the code for the exit reason. If the value returned is6, that means the application was terminated because it was unresponsive due to the fact that an ANR happened.
That’s neat, but how can we see where the ANR happened from? For that we can use getTraceInputStream. Like the name implies, the returned value is an InputStream of bytes which needs to be read like any other InputStream. An example output looks like the following:
This is only a partial snippet of all the output, but you can see that it provides a ton of information, including:
- Free memory/Total memory/Max memory
- Heap diagnostic (percentage free, size and amount of objects allocated)
- The stacktrace of the main thread
Other useful methods include:
- getTimestamp – the timestamp of when the process terminated
- getDescription – a system description of why the process terminated
Be Resourceful
If your application does suffer from ANRs, solving them can be quite tricky. Whether it is not getting a complete stacktrace (or not having one at all), not being able to reproduce it or it happening on some esoteric device. Well, what can you do?
In Android Studio version ≥ 3.2, you have a utility called CPU Profiler. This tool lets you inspect your thread activity during the runtime of your application. With it, you might find out which threads are running, for how long and where they are running.
To use it, inside Android Studio, go to View → Tool Window → Profiler
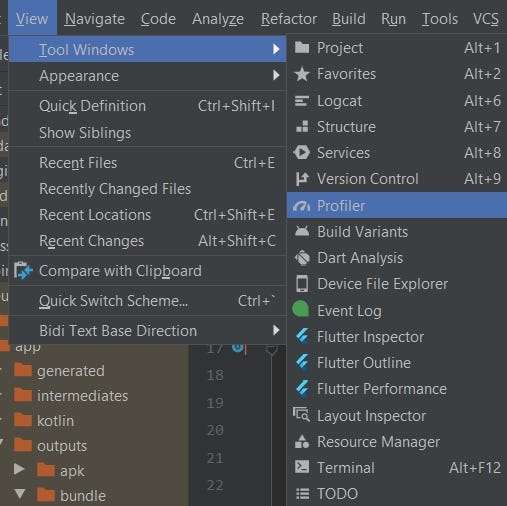
A window will open at the bottom of the screen and once you attach a process to it, you will see three timelines:
- Event timeline
- CPU timeline
- Thread timeline
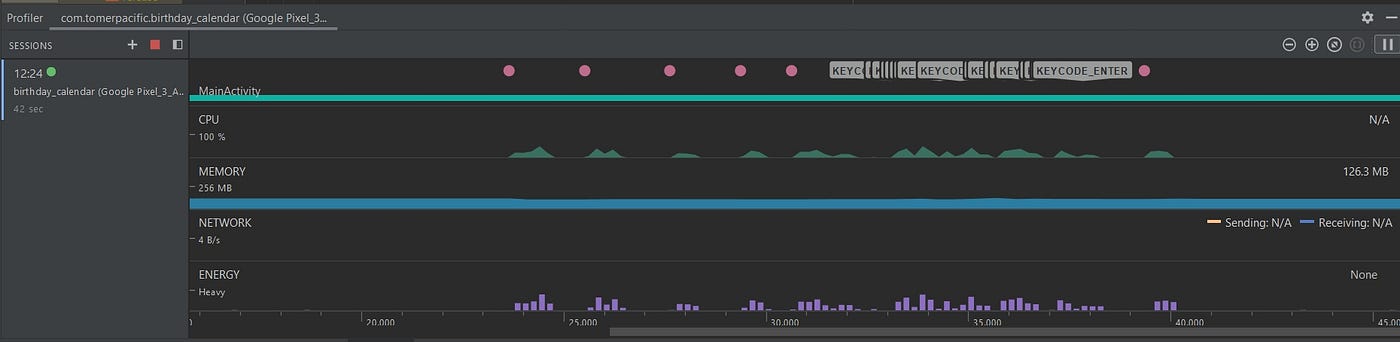
You want to focus on the Thread timeline to see if anything is out of the ordinary there. Each thread’s activity can be identified by three colors:
- Green – indicates that the thread is running or in a runnable state
- Yellow – indicates that the thread is waiting for the execution of some I/O operation
- Gray – indicates the thread is sleeping
Hopefully, by now, you have gained some confidence in making your applications as ANR proof as you can. Using the tools and techniques listed above may help prevent your application’s next ANR.
You are welcome to check out some of my other articles below: