Do you know that feeling when you’ve finished working on a feature, pushed the code, but then your CI system refuses to respond?
Lagging or slow responsiveness is very common among Jenkins users, and you can find many reported issues on it. Slow CI systems are frustrating, they make you develop slower and waste your time. I have worked on several Jenkins systems with various versions (1.x and 2.x), tens of slaves and hundreds of builds per day. I have managed to improve the performance of those systems using a few simple guidelines. In the following post I will share 5 tips that can make your Jenkins better, and put a smile on your developers’ faces.
Tip 1: Minimize the amount of builds on the master node
The master node is where the application is actually running, this is the brain of your Jenkins and, unlike a slave, it is not replaceable. So, you want to make your Jenkins master as “free” from work as you can, leaving the CPU and memory to be used for scheduling and triggering builds on slaves only. In order to do so, you can restrict your jobs to a node label, for example:

In the case of pipeline jobs, put the label when allocating the node, for example:
stage("stage 1"){
    node("ParallelModuleBuild"){
        sh "echo \"Hello ${params.NAME}\" "
    }
}
In those cases, the job and node block will only run on slaves labeled with ParallelModuleBuild.
Tip 2: Do not keep too much build history
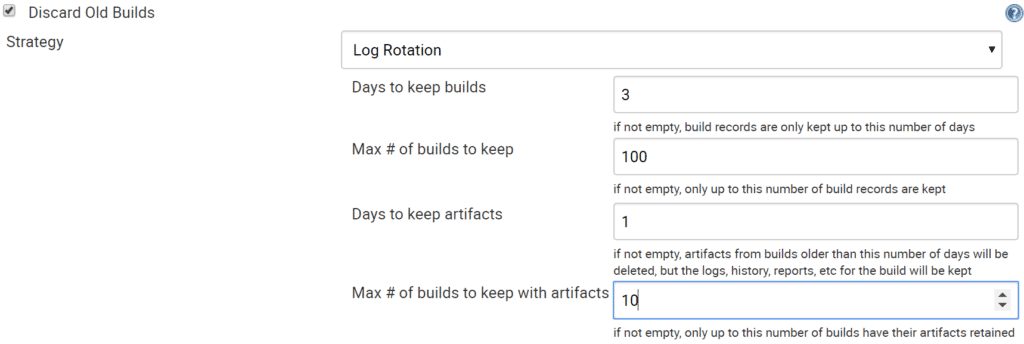
When you configure a job, you can define how many of its builds, or for how long they, will be left on the filesystem before getting deleted. This feature, called Discard Old Builds, becomes very important when you trigger many builds of that job in a short time. I have encountered cases where the history limit was too high, meaning too many builds were kept on the filesystem. In such cases, Jenkins needed to load many old builds – for example, to display them in the history widget, – and performed very slowly, especially when trying to open those job pages. Therefore, I recommend limiting the amount of builds you keep to a reasonable number.

Tip 3: Clear old Jenkins data
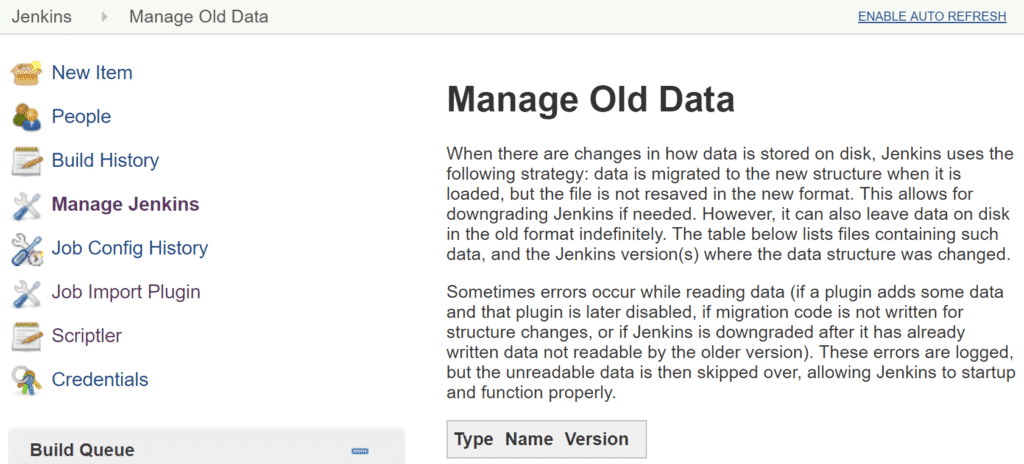
In continuation to the build data from the previous tip, another important thing to know is the old data management feature. As you probably know, Jenkins keeps the jobs and builds data on the filesystem. When you perform an action, like upgrading your core, installing or updating a plugin, the data format might change. In that case, Jenkins keeps the old data format on the file system, and loads the new format to the memory. It is very useful if you need to rollback your upgrade, but there can be cases where there is too much data that gets loaded to the memory. High memory consumption can be expressed in slow UI responsiveness and even OutOfMemory errors. To avoid such cases, it is best to open the old data management page (http://JenkinsUrl/administrativeMonitor/OldData/manage), verify that the data is not needed, and clear it.
Tip 4: Define the right heap size
This tip is relevant to any Java application. A lot of the modern Java applications get started with a maximum heap size configuration. When defining the heap size, there is a very important JVM feature you should know. This feature is called UseCompressedOops, and it works on 64bit platforms, which most of us use. What it does, is to shrink the object’s pointer from 64bit to 32bit, thus saving a lot of memory. By default, this flag is enabled on heaps with sizes up to 32GB (actually a little less), and stops working on larger heaps. In order to compensate the lost space, the heap should be increased to 48GB(!). So, when defining heap size, it is best to stay below 32GB. In order to check if the flag is on, you can use the following command (jinfo comes with the JDK):
jinfo -flag UseCompressedOops <pid>
Tip 5: Tune the garbage collector
The garbage collector is an automatic memory management process.
Its main goal is to identify unused objects in the heap and release the memory that they hold. Some of the GC actions cause the Java application to pause (remember the UI freeze?). This will mostly happen when your application has a large heap (> 4GB). In those cases, GC tuning is required to shorten the pause time. After dealing with these issues in several Jenkins environments, my tip contains a few steps:
- Enable G1GC – this is the most modern GC implementation (default on JDK9)
- Enable GC logging – this will help you monitor and tune later
- Monitor GC behavior – I use http://gceasy.io/
- Tune GC with additional flags as needed
- Keep monitoring
- Read this post and this one – these are great posts about GC tuning
Now it’s your turn
Jenkins responsiveness issues are very common, but can be dealt with. In one of the environments I worked on, I had a configuration page which took over a minute to open. After implementing the above tips, especially G1GC and old data, this page opened in a split second.
If you got this far, you are probably familiar with this issue. So, try my tips and share what worked for you and what hasn’t. There is a good chance your Jenkins will speed up too.
You are welcome to tweet me for any question :)


