Tracking the number of people who return to your site and how often they do so can be an important way to observe how your audience develops over time. These figures are easily captured in metrics called “sessions-per-user” and “returning visitors.”
Different websites use these metrics in different ways. Publishers might want to examine the yield of their audience development efforts, gauging the success of their social media strategy and SEO optimization. Direct marketers might be more interested in discrete time frames based on their specific sales cycle, ranging from a week to a month to a quarter.
Identifying loyal visitor behavior is essential to anyone invested in building an online presence, and the sessions-per-user and new-versus-returning metrics are key to achieving this goal.
Know What You’re Looking For
Before diving into the data, it’s important to confirm that returning-visitor metrics are a key performance indicator for your business. While some sites are able to convert users into paying customers on their first visit, many sites rely on users coming back multiple times in order to earn ad revenue or transform visitors into paying customers over time.
Before diving into the data, it’s important to confirm that returning-visitor metrics are a key performance indicator for your business. While some sites are able to convert users into paying customers on their first visit, many sites rely on users coming back multiple times in order to earn ad revenue or transform visitors into paying customers over time.
The first step in analyzing your audience development efforts is to see how many of your on-site visitors have been there before. Platforms such as Google Analytics enable companies to easily visualize their returning audiences by separating out first-time visitors from returning visitors:
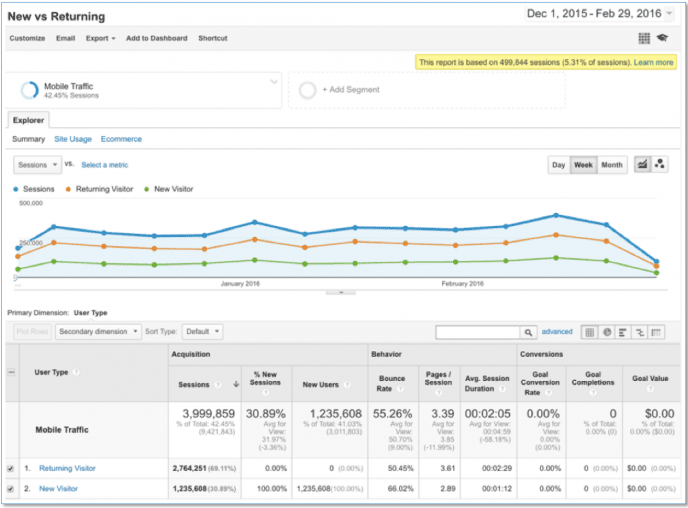
Many sites find that a majority of their visitors will register just one session. These are often drive-by users that arrived from social media or search, and such fleeting audiences present an immediate growth opportunity if you can encourage those visitors to come back to your site (as discussed further down this post).
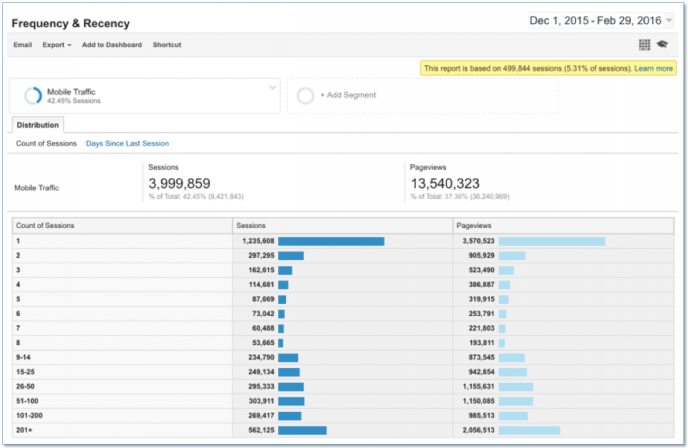
Once you’ve determined how many visitors have returned to your site, it will be useful to look at how many times they return within a given timeframe. Looking at a “sessions per user” report will show you this, and you’ll want to analyze the data over a period of time that is most useful for your purposes (e.g. daily, week-by-week, quarterly).
It’s common to see a sessions-per-user report follow a sort-of “reverse hourglass” pattern, with lots of visitors registering one session, fewer registering two sessions, still fewer registering three. The pattern eventually reverses to show multiple visitors registering six, seven, or more visits throughout the selected timeframe. The number of people returning to a site will wane at a certain point, but only to come back strong as a reflection of the site’s committed followers.
Fluctuations in how often people return to your site further reveals how deeply your site, content, or brand are resonating with different audiences over time. When sessions-per-user surges, it could mean customers are finding your content more valuable or that other retention efforts (like social initiatives, a newsletter, or blog development) are paying off. When it drops, it’s time to go back to the drawing board and come up with better ways to get your visitors to return.
Identify Your Most Engaging Content (and Create More of It)
Beyond serving as a benchmark for your previous content promotion efforts, returning-visitor metrics can also inform new content strategies — as long as your team can be honest with themselves about which content is or isn’t working.
Using your analytics package, identify which stories are only getting single-visit users, then form some theories about why those stories aren’t succeeding. Refine your content strategy by testing your theories and creating different types of content until you find something that works.
The amount of pages-per-visit generated by a particular piece of content can also be a key indicator in determining which topics are resonating most with your audience, and which content seems to stall, bringing in single-visit users or none at all. You should, of course, create more of the former, less of the latter.
Don’t be afraid to ask your readers for content suggestions. The classic sales maxim of “the customer is always right” remains true even in the content world. If people share or respond to your content, you’re creating the right stuff. Regardless of whether you encourage an actual purchase or newsletter subscription during that first visit, treat your readers as customers, and know that they’re voting for what they like with their clicks.
Feedback loops are also an important tool for gauging your audience’s interests and hearing about the topics they’re most interested in reading about. While many publishers have turned off comments on their sites because the sections often become too hard to police, your readers might just surprise you with some compelling ideas, and seeing those suggestions implemented could make them more invested in your site.
Build Rapport and Increase Sessions-Per-User
The content you create is only valuable if your audience can easily find and enjoy it on a regular basis.
The most important first step is to make sure you have a presence wherever your audience spends the majority of their time. For most companies, that mandate requires a robust social media strategy including Facebook and Twitter, but other social networks may prove just as important for your brand. Instagram and Pinterest can be valuable for image-heavy sites, and many brands find niche audiences on sites like Reddit.
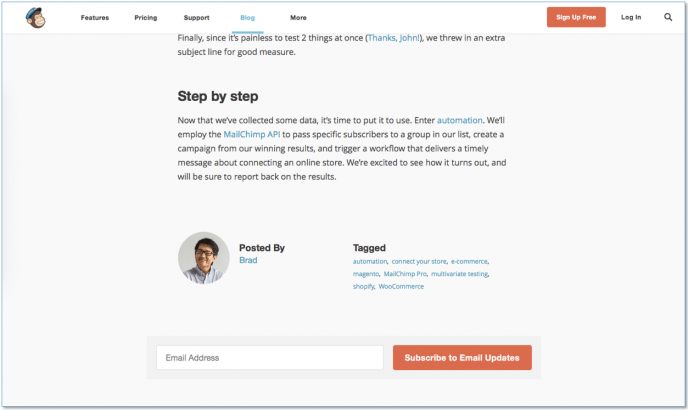
Newsletters are another way to update your most interested readers and help them engage more deeply with your brand. The recent growth of email marketing solutions like MailChimp and TinyLetter attest to the value of a finite, personalized message amidst a sea of never-ending feeds.
The user experience is also crucial to encouraging on-site audiences to consume and engage with more of your site. In addition to having a clean page layout, “related content” recommendations (like Taboola’s discovery platform, as seen below this article) give your visitors something else to check out after they read the page they originally visited. By moving your visitors beyond a single-page session, you further increase their likelihood of returning again in the future.
In Conclusion
Sessions-per-user metrics provide a meaningful glimpse into the ongoing progress of your audience development efforts. If this number is increasing, your content is effectively engaging loyal users. If it’s going down, your site might be difficult to navigate or your content might not be resonating with your audience.
These metrics relate directly to your bottom line. If you generate revenue from pageviews, remember that those pageviews in any given time frame are a result of the following; (Users) x (Sessions-Per-User) x (Pages-Per-Session). If you’re selling something directly on your site, the equation may be slightly different, but you’ll never hurt your bottom line by building loyal site visitors.
In my next post, we’ll be talking more about how equations like the above can serve as a working framework for improving your efforts around building an audience, engagement, and monetization. But, for now, remember that sessions-per-user and other returning-user metrics provide a clearer picture of how engaged your audience is over time. When you make it easy and appealing to interact with your site, that change will ultimately be one of positive growth.