What is the connection between kernel system calls and database performance, and how can we improve performance by reducing the number of system calls?
Performance of any database system depends on four main system resources:
- CPU
- Memory
- Disk I/O
- Network
Performance will increase while tuning or scaling each resource – this blog will cover the CPU resource.It’s important to note that whenever we release a bottleneck in the system, we might just encounter another one. For example, when improving CPU performance the database load shifts to IO, so unless our storage is capable of delivering more IOPS, we might not actually see the improvement we hoped for. But don’t be discouraged, performance tuning is sometimes a game of whack-a-mole…
We all know that the more processing power available for your server, the better the overall system is likely to perform. Especially when the CPU spends the majority of its time in user state rather in kernel state. At Taboola we struggled with two cases which caused Kernel state to consume a lot of CPU; your system might have the same problems.
How do we collect CPU metrics at Taboola?
Metrics are collected using Sensu and Graphite, dashboards are built with Grafana. The Sensu CPU plugin cpu-metrics.rb collects the following CPU metrics: user, nice, system, idle, iowait, irq, softirq, steal, guest. Since the Vertica process runs in a CPU user space that has been niced, we will mostly focus on the nice and system metrics.
System calls CPU impact by calling Vertica new_time function
What are system calls?
System calls are how a program enters the kernel to perform a task. Programs use system calls to perform a variety of operations such as: creating processes, performing network and file IOs, and much more.
If a system call is such a basic internal interface between an application and the Linux kernel, why should we care about it?
- Sometimes this is the case, However if the system calls’ CPU usage remains high for long periods of time, then it could be an indication that something isn’t right. A possible cause of system calls’ spikes could be a problem with a driver/kernel module or sometimes due to high concurrency
- To run a system call the CPU needs to switch from the user to kernel mode, that’s called context switch, context switching itself has performance costs.
At Taboola, all timestamp data is saved in UTC timezone. Aggregated reports for raw data tables produce reports converted to the publisher (customer) timezone using Vertica’s “new_time” function to convert between time zones.
For example, aggregating actions by hours:
SELECT date_trunc('hour',
new_time(action_event_time,p.time_zone_name, 'UTC')
), count(action_name)
FROM actions a
JOIN publishers p ON a.action_publisher_id = p.id
WHERE a.action_event_time BETWEEN new_time('2017-04-20 00:00:00.0',p.time_zone_name, 'UTC') AND new_time('2017-04-24 23:59:59.999', p.time_zone_name,'UTC')
GROUP BY 1;
The following image represents a server’s overall CPU usage over time, stacking all types of CPU metrics:
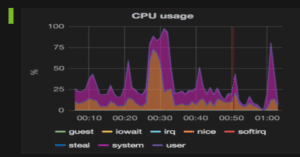
System CPU Usage:
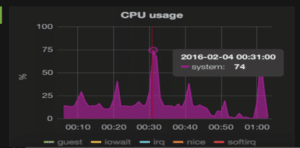
We can see regular spikes in usage reaching up to 74%. We need to profile our CPU calls to find the root cause.
How do we profile CPU calls?
Linux perf is a powerful tool to diagnose this, and a FlameGraph can be used to virtualize the perf report by drawing a graph.
Useful perf commands:
- perf top – realtime events
- perf record – run a command and record its profile into perf.data
- perf report – read perf.data (created by perf record) and display the profile
Running the following commands will record and report CPU calls for a duration of 5 minutes:
perf record -F 99 -a -g -- sleep 300

-- Take 99 samples/second for five minutes

perf report - -sort cpu > /tmp/report.out

-- Generate calls reports order by cpu time
The /tmp/report.out file output shows the following:
67.72%           vertica  [kernel.kallsyms]
          [k] __ticket_spin_lock
          |
          --- __ticket_spin_lock
             |
             |--99.38%-- _raw_spin_lock
             |          |
             |          |--53.12%-- futex_wake
             |          |          do_futex
             |          |          sys_futex
             |          |          |
             |          |          |--100.00%--system_call_fastpath
             |          |          |          |
             |          |          |          |--99.98%--__lll_unlock_wake
             |          |          |          |          |
             |          |          |          |          |--99.95%-- getTZoffset
             |          |          |          |          |	   |
             |          |          |          |          |	   |--35.86%-- _ZN2EE5VEval16ZoneTS_TStz_SkipEPciiPi
             |          |          |          |          |     |           _ZN2EE5VEval16ZoneTStz_TS_SkipEPciiPi
If flame graph is installed, we can run:
perf script > /tmp/script.out
FlameGraph-master/stackcollapse-perf.pl /tmp/script.out > /tmp/flame_out.folded
FlameGraph-master/flamegraph.pl /tmp/flame_out.folded > /tmp/kernel.svg
Flame Graph (kernel.svg) example:
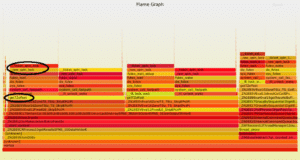
Each call to new_time function triggers the OS call getTZoffset, while many simultaneous calls are causing kernel contention expressed by spin locks.
Solution
We removed the use of the new_time function, and started joining our data to “conversion tables” instead.
We created two timezone tables that contain a local time for each timezone and the corresponding time in UTC:
1. time_zone_daily_conversion
2. time_zone_hourly_conversion
Daily Table Definition
          Column         |     Type     | Size |     Default
----------------------------+------------------------+----------
 time_zone_name         | varchar(400) |  400 |
 day                    | date         |    8 | NULL::date
 day_starts_at_utc      | timestamp    |    8 | NULL::timestamp
 day_ends_at_utc        | timestamp    |    8 | NULL::timestamp
Sample Content
   time_zone_name    |    day     |  day_starts_at_utc  |   day_ends_at_utc
---------------------+------------+---------------------+---------------------
 Africa/Nairobi      | 2017-07-28 | 2017-07-27 21:00:00 | 2017-07-28 20:59:59
 America/Bogota      | 2017-07-28 | 2017-07-28 05:00:00 | 2017-07-29 04:59:59
 America/Mexico_City | 2017-07-28 | 2017-07-28 05:00:00 | 2017-07-29 04:59:59
 America/Sao_Paulo   | 2017-07-28 | 2017-07-28 03:00:00 | 2017-07-29 02:59:59
 Asia/Bangkok        | 2017-07-28 | 2017-07-27 17:00:00 | 2017-07-28 16:59:59
Hourly Table Definition
       Column         |     Type     | Size |     Default
---------------------+--------------+------+-----------------+---
  hour_at_utc            | timestamp    |    8 | NULL::timestamp
  time_zone_name         | varchar(400) |  400 |
  hour_at_time_zone      | timestamp    |    8 | NULL::timestamp
  day                    | date         |    8 | NULL::date
Sample Content
      hour_at_utc     |  time_zone_name  |  hour_at_time_zone  |    day
---------------------+------------------+---------------------+------------
 2017-07-28 00:00:00 | Pacific/Auckland | 2017-07-28 12:00:00 | 2017-07-28
 2017-07-28 00:00:00 | US/Central       | 2017-07-27 19:00:00 | 2017-07-27
 2017-07-28 00:00:00 | US/Eastern       | 2017-07-27 20:00:00 | 2017-07-27
 2017-07-28 00:00:00 | US/Mountain      | 2017-07-27 18:00:00 | 2017-07-27
 2017-07-28 00:00:00 | US/Pacific       | 2017-07-27 17:00:00 | 2017-07-27
Example of aggregating actions by hours using the conversion tables:
SELECT hour_at_utc, count(action_name)
FROM actions a
JOIN publishers p ON a.action_publisher_id = p.id
JOIN time_zone_hourly_conversion tz
ON p.time_zone_name = tz.time_zone_name
WHERE tz.day BETWEEN '2017-04-21' AND '2017-04-23'
AND action_event_time BETWEEN '2017-04-20 00:00:00.0 '
AND '2017-04-24 23:59:59.999'
GROUP BY 1;
Result
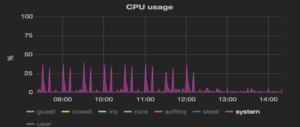
Query time reduced by 50-75%, system calls CPU metric graph shows:
Conclusion
- It is essential to monitor server metrics (CPU, memory, load, and others) to identify performance bottlenecks.
- Perf is a great profiling tool to drill down into the major system calls.
- In our case we found the issue was caused by spin locks, but other customers’ clusters or use cases might suffer from other kernel calls.