This post is not about K8S – nor is it about AWS. It is not about containers – nor is it about some new, “cool” technology for managing large-scale applications. Rather, this post is about how we deploy a highly sophisticated Java service, a heavy service that is very actively developed on a daily basis, to 1000s of servers across our 7 data centers around the world.
So what’s the problem? Isn’t it enough to take a list of servers, get the version to deploy and run it with an automation tool like ansible?
Well, it’s not as simple as it might seem. This service serves Taboola’s recommendations and responds to hundreds of thousands requests per second. The service has to be fast – so fast that its p95 should be below 500 milliseconds per request. Which means we can’t have any downtime at all, or even afford slower responses.
In addition, it’s critical to prevent the installation of a faulty version. A faulty version could lead to downtime or degraded performance, which can directly result in a loss of revenue. For this reason, we have multiple testing gateways during development – to help prevent a bad version. However, based on our experience, sometimes when the software meets production, unexpected (bad) things happen – and we need to be ready to prevent that. Another important requirement is to deploy during office hours, when most of the engineers will be available to assist should something go wrong.
So how do we do that?
In the following post, I will explain how we deploy our Recommendation Service at Taboola. The post will detail the deployment flow, step by step.
Stage 1: Is today a deployment day?
The first thing we want to do is to check if today is a deployment day. The requirement is to deploy during working hours, so if it’s a weekend or a holiday, we skip the deployment.
Stage 2: Is today’s version valid?
It’s a deployment day and we want to know that the code is valid and isn’t going to cause any production issues. This is why our first step is canary testing. In this stage we deploy the new version to a single machine in each of our 7 data centers around the world. After the service is ready, we let it run with real traffic for one hour. During that hour we gather various metrics – from the newly deployed server, as well as a server with the old version. These servers must have the same hardware specs; in addition, we also restart the old version to make sure the environments are as equal as possible. When the hour is up, we compare the results. Every metric has a well defined threshold. If the newly gathered metrics are within the boundaries of those thresholds, we can continue to the next stage. If the new version “misbehaves”, we stop, alert the relevant developers and analyze the issues. After the analyses, we can still go either way: abort the deployment (will happen automatically) or approve manually.
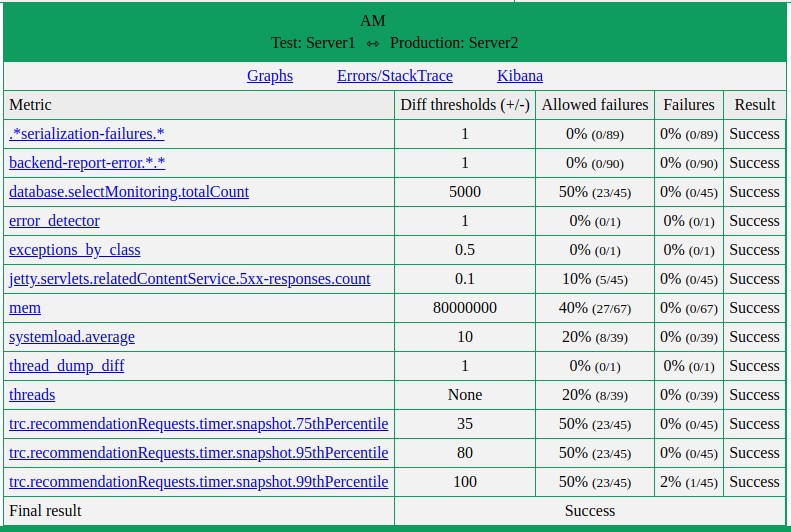
Example for metrics compare from the canary testing
Stage 3: Data center verification – part 1
The new version seems to be OK – at least as much as we can verify in 1 hour – and we decide to continue with the deployment. However we still want to ‘play it safe’. Enter stage 3: data center verification. We start deploying slowly on only one of our data centers. The first data center is carefully chosen by production engineers. It has to be outside of peak hours in that specific geographic area, but still have enough traffic for us to verify.
The deployment procedure on a single data center goes like this:
- Get the list of servers to be deployed
- Calculate the size of the server batch (see below)
- For each server in the batch
- Silence all alerts
- Stop the old version and remove it
- Install the new version
- Start the service
- Verify that the service started correctly
- Unsilence all alerts
- Run a batch verification to check various metrics of the domain
- Wait for a minute for the next server batch
- Repeat until no servers are left
When the deployment on the data center finishes, we enter the validation phase – but first, let’s get back to the calculation of the server batch.
Let’s do some math
As mentioned above, when we deploy the new version, we don’t want to affect our ability to serve requests in the appropriate response time (<= 500 milliseconds). Therefore, we developed a formula that will tell us how many servers we can take out of the data center’s pool without causing “noise”. The formula looks like this:
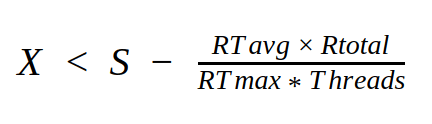
Where:
- X is the amount of servers we can currently stop.
- S is the total amount of functioning servers in the data center.
- Rtotal is the total amount of requests in the data center.
- RTavg is the average response time per request.
- RTmax is the critical limit for the response time.
- Threads are the amount of threads we use per server.
When we get X, we normalize it so we won’t stop too many servers in off-peak hours – or too few servers in peak hours.
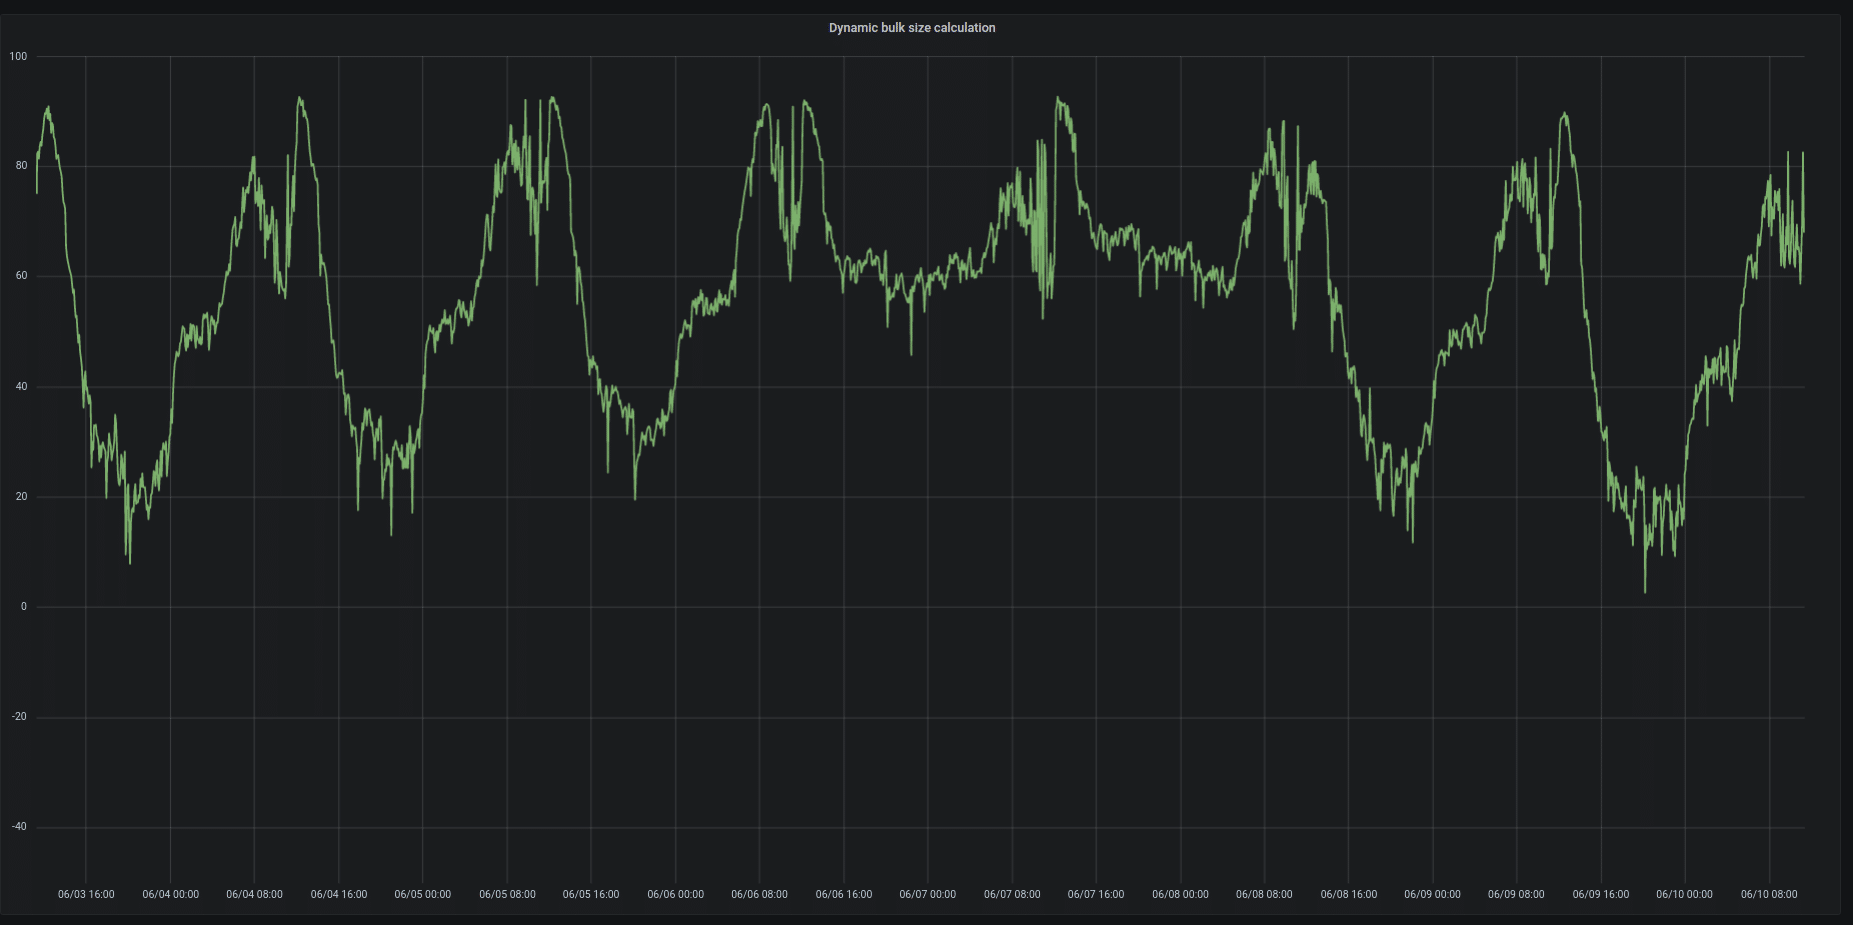
Batch size calculation from June 3rd to June 10th
Stage 3: Data center verification – part 2
OK – we deployed the first data center, and now we want to validate that it behaves correctly. We pause the deployment for one hour and perform several checks. The important ones are:
- Check that the response time did not increase.
- Check that the server logs contain no unusual errors.
These metrics are monitored periodically, regardless of the deployment flow. In order to catch production issues faster, we integrated these checks into the flow.
Any issue that arises at this point will raise an alert and pause the flow, until it is either approved manually or is manually or automatically aborted.
Stage 4: New version for all
When we get the “green light” from the first data center deployment and verification, the flow will automatically continue to deploy the rest of the data centers in parallel.
Deliver value and quality in 6 steps
Want to build your own deployment process? We suggest implementing the following steps:
- Test your code continuously – although not mentioned yet, code review is mandatory and unit and integration tests are a crucial part of code validation.
- Collect metrics – both for the deployment and the production service – all the time.
- Build a process that can validate the new code in production with real data/traffic. Compare with the metrics you collect.
- Define the proper pace for deploying – you probably want it to be dynamic. Figure out the right pace for your specific needs.
- Continuously validate that the new code doesn’t break anything.
- Continuously improve.
If you have questions, suggestions or comments, feel free contacting me at @tizkiko
Good Luck!
Technology used
A note about the tools we used to build the flow. The service is written in Java and packed as rpm. The logic of the deployment flow is written with Jenkins pipeline, mostly Groovy with some calls to shell commands (yum install, for instance). We use Grafana and Prometheus for monitoring and metrics.
I would like to take this opportunity to thank Taboola’s Release Engineering and Production Engineering teams, who helped build this great process.