You’re expensive if you own content marketing at your company—unless you can prove that the cost of content creation is worth it. If you can, you’re not an expensive nice-to-have, you’re a business asset. To get there, you need a system to measure the return on the investment it take to create your content creation and distribute it, or ROI.
Pinpointing your return on investment or ROI goes beyond just proving the worth of your work. It’s essential to determine whether or not your efforts are impacting your business goals, but also to prioritize the endless list of potential content projects to focus on and to effectively communicate your successes to your executive team.
So, what’s your content marketing ROI?
If you can’t answer this question, you’re not alone. Whether your content marketing is meant to impact brand awareness, performance marketing, revenue, or something in between, measuring the ROI of content marketing can be a lot less black and white than it is for other types of marketing.
Today we’ll dive into exactly how to calculate ROI for your content marketing efforts, with step-by-step instructions to pulling the metrics that matter. We’ll also share some content marketing tips and best practices along the way.
What is Content Marketing ROI?
Content marketing ROI is a percentage that results from comparing the cost of creating and distributing content, versus the business revenue that resulted from those efforts.
This is true even if you operate to achieve brand awareness goals. I assure you, there is no company out there that spends money on brand awareness campaigns for their health—they do so because they believe that brand awareness campaigns will eventually impact their bottom line, and if you can prove that it does, you’ve proven the worth of your work.
How to Measure Content Marketing ROI
In order to measure your content marketing ROI, you need to know how much you’ve spent to create and distribute content, and how much revenue came in. You may have heard the phrases, “we’re ROI positive,” or “we’re ROI negative.”
On the most basic level, being ROI positive means more money came in then went out—your ROI is at least 1%. ROI negative is the exact opposite, more money went out than came in—your ROI is -1% or lower. If your ROI is 0%, you broke even.
Here’s a simple ROI formula to illustrate this calculation, which the folks over at WallStreetMojo illustrated nicely:
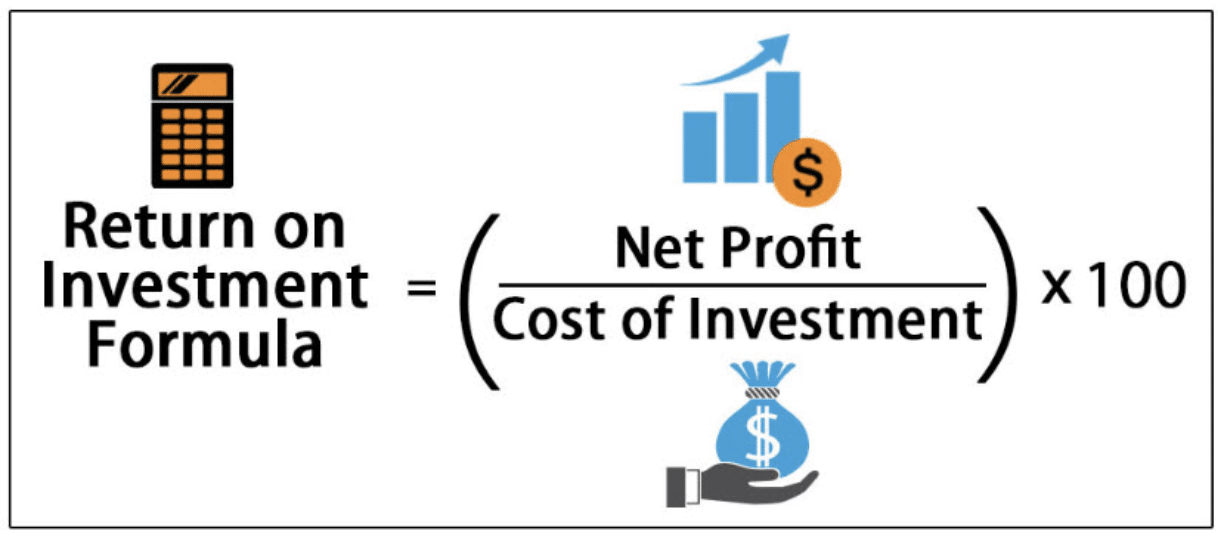
The formula itself is simple, it’s defining its components that can be difficult.
Take for example, the cost of investment. How much does it cost you to create a single blog article? Assuming you wrote it yourself, it’s free, but is it really?
- How much did your company spend in hours for you to write that post?
- Did others review it, how much time did they spend?
- Were custom images created by designers? How much time did they spend?
- Where was it published? Do you own that domain? How much does it cost to own it?
- Did you pay to distribute it, perhaps on publisher sites or social media channels? How much did you spend?
The real ROI of your content marketing efforts will take all of this into consideration when determining how much it really costs to create and distribute something and how this connects to your performance marketing efforts.
When it comes to measuring the return though, all you have to do is track how many people read the blog post and then made a purchase right? Well, most often, people need to do more than just read a single blog post in order to make a purchase.
Attributing revenue to a blog article means considering revenue in (at least) two different buckets:
- Sales that can be attributed to that blog article only, meaning that person read that one single article, did not interact with your company in any other way, and then made a purchase.
- Sales that were influenced by content, meaning that person read your blog article and made a purchase, but maybe they visited other pages of your website and interacted with a sales person before they did so.
Scenario #1 will be few and far between, whereas scenario #2 is much more likely. Because of this, it’s hard to pinpoint content marketing’s ROI individually without advanced lead scoring, the process of scoring a person’s interactions with different marketing assets to quantify their value in the purchase journey. If you’re not set up for lead scoring, don’t be discouraged. You can still track the ROI of sales your content has influenced, as long as you discuss it in those terms.
Ultimately, your ROI is a result of a lot of activity—it’s the result of people hearing about you for the first time, finding your content, engaging with it, becoming and lead and eventually making a purchase. Measuring your content marketing efforts means measuring content’s impact at each of these stages.
How to Measure Content Marketing Success
For content marketing to be successful, you have to have a documented content marketing strategy, which in short, is a list of high-level goals you want your content marketing efforts to support and plan for reaching them.
Those high-level goals might look something like this:
- Generate more sales
- Create more leads
- Change people’s perception of my product for the better
- Increase the number of potential customers that know about us
- And many others
You might embark on several types of content marketing to get there, from blog articles to video channels to an Instagram handle, and more. But in order to achieve these goals, you’ll want to measure certain metrics to allow you visibility into whether or not you’re on track.
But you need a strategy first—once you know why you do content marketing, the key metrics should fall into place.
Top Content Marketing Metrics
Once you’ve set your goals, it’s time to to dive into tracking the individual metrics that give you visibility into them. The high-level content marketing metrics that matter most are the following:
- Sales & Revenue
- Lead Generation
- Traffic
- On-site Engagement
- Social Media Engagement
- SEO
- Exposure and Authority
- Sentiment
Let’s dive into why these metrics are important, why it’s important to track them and exactly how you can measure them.
Sales & Revenue
There’s nothing more powerful to prove the worth of your content marketing efforts than proving an influence or direct impact on sales or revenue.
How you ultimately track your impact on sales or revenue will depend on your marketing tech stack—if your organization uses a customer relationship management (CRM) tool, like Salesforce, HubSpot or Mailchimp, they’ll likely have options for you to connect your Google Analytics dashboard in order to easily display a sales impact on your efforts.
If a CRM dashboard isn’t in the cards, you can use Google Analytics to track your sales impact directly by setting up conversion goals. Goals can include many things, including purchases, form fills, time on site, traffic, and much more.
Here’s an example screenshot from a crafting blog that sells knick-knacks for the home. His dashboard tracks the number of products sold from a list of URLs on his blog. A quick look at Goals > Conversions > Overview shows him which articles are impacting his bottom line the most.
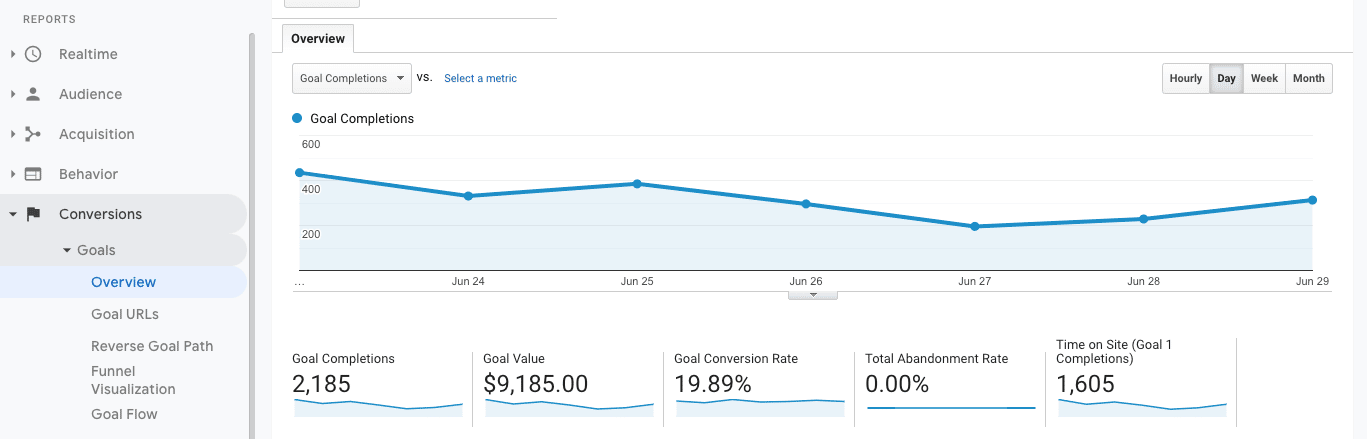
Before becoming a statistic in this example Google Analytics dashboard, these sales were probably leads first, and the more you can optimize lead generation, the more sales you’ll ultimately drive.
Lead Generation
Many have said it before and I’ll say it again—the purpose of content marketing is to attract an audience. A loyal audience that is, one that raises their hand in some digital way to alert you to the fact that they find your content valuable, and when doing so, alert you to the fact that they should be considered a potential future customer.
In other words, a lead.
Lead generation is important to track because your efforts in nurturing them eventually lead to sales, which eventually leads to higher content marketing ROI.
The number of leads your content is generating is another metric that can be tracked in a CRM if you have one available, but if not, you can use Google Analytics to do this as well.
This example from OptinMonster illustrates how to use funnel visualization by traveling to conversions > goals > funnel visualization to do so:
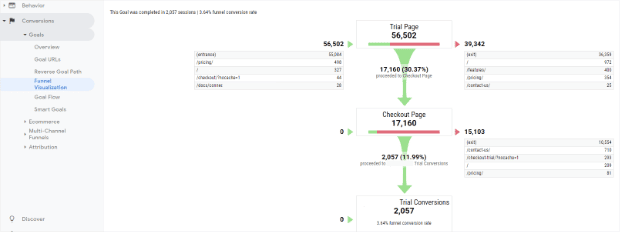
To capture more leads, more people will have to find you first, and for that you’ll need To capture more leads, more people will have to find you first, and for that you’ll need more website traffic.
Traffic
Website traffic is the crux on which lead generation and sales rest. Without people visiting your website and your content assets, there is no one to become a lead or to convert to a sale.
Often considered top of the funnel marketing, the practice of increasing website traffic is the process of connecting more relevant people with your landing pages, whether they be blog articles, product pages, gated content, or another type.
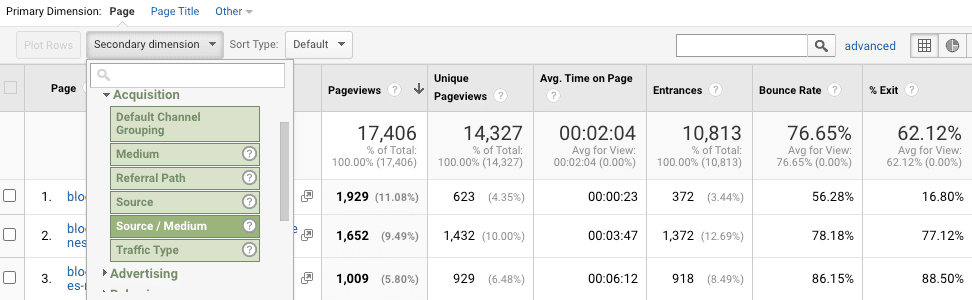
Measuring your website traffic is most easily done in Google Analytics, and can be easily seen by navigating to Behavior > Site Content > All Pages. Doing so provides you with a traffic breakdown over time, as well as by URL.
Here’s another screenshot from our example crafting blog:
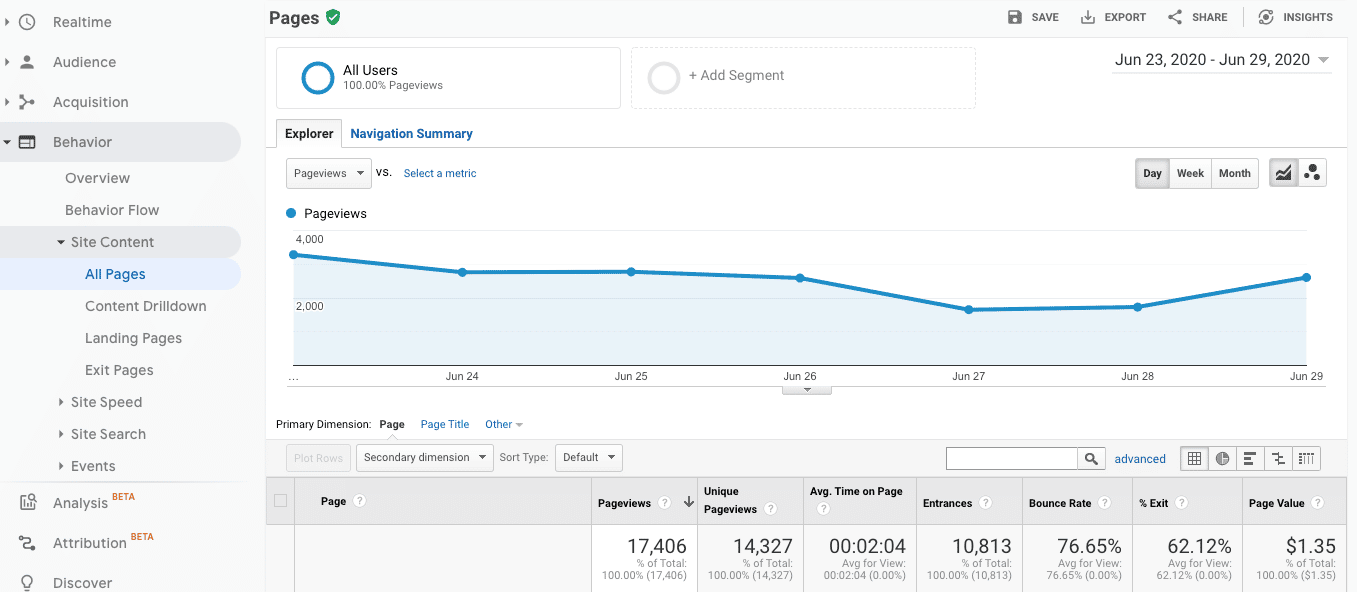
Here he can see that he received 17,406 visits that day, how many of those pageviews were unique, the average time on site, and more. Digging further into various URLs will allow him to determine which articles are performing best for him at this time.
On-site Engagement
On-site engagement is a fancy way of saying quantifying an answer to the question, “did my audience find my content valuable?” To answer this question, we can look at many different metrics, including:
- Pageviews: the number of time each page was visited
- Unique visitors: the number of people who visited those pages
- New vs. returning users: out of the number of people who visited those pages, how many visited the site previously, and how many were new?
- Behavior flow: if any of those people visited more than one page while they were there, which pages did they visit, and in what order?
- Average time on page: on average, how much time did people spend consuming a piece of content?
- Bounce rate: how many people landed on the page and left without scrolling down?
- Pages per session: on average, how many pages do people visit when they visit your website?
- Traffic sources: where did these visitors come from?
All of these are a different way to measure how engaged your audience is. In my opinion, it takes a combination of all of these metrics to paint a true picture of an engaged audience, all of which can be measured in Google Analytics.
By traveling to Audience > Overview you can measure most of these metrics:
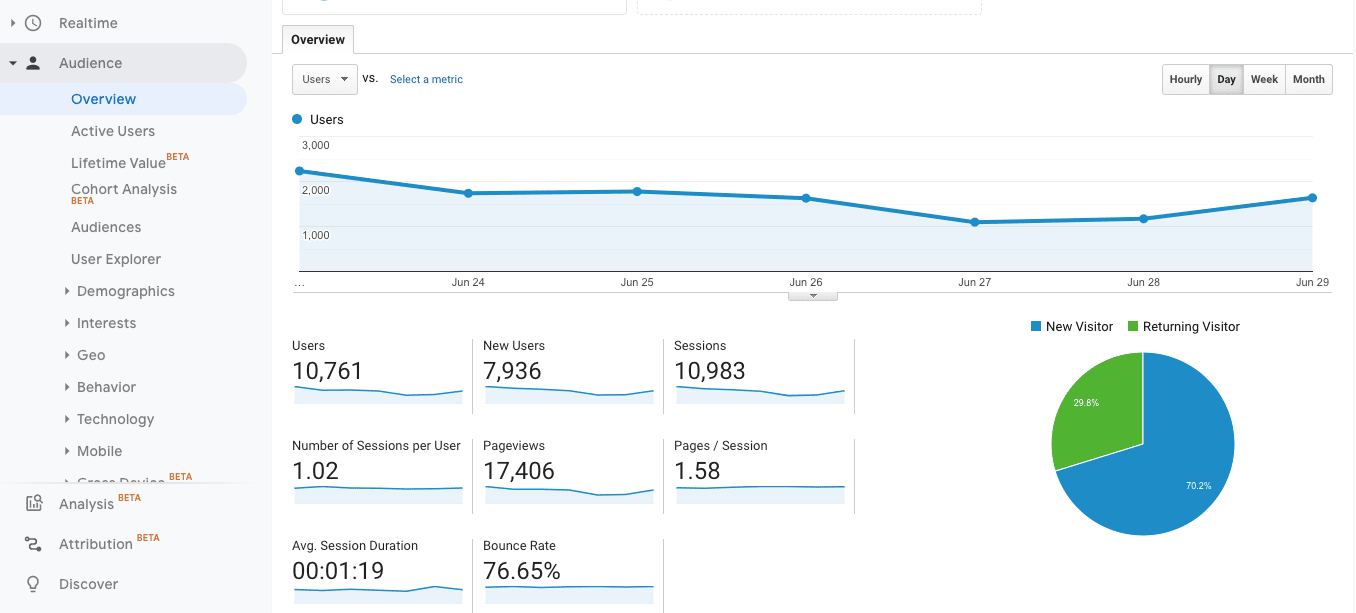
You can find your traffic sources in Behavior > Site Content > All Sources, and filtering by Source/Medium:
Up until now, we’ve covered all of the major metrics used to analyze content on your own hosted domains, but it’s also important to take into account the performance of the channels you use to drive traffic to your site in the first place.
Social Media Engagement
Social media is a popular channel used to reach audiences where they are online, and drive them back to your website. Using the method we mentioned above, you can easily determine just how much social media drives, but in order to understand how likely your social media audience is to convert to traffic, you’ll need to measure your engagement.
Social media engagement is often measured with the following metrics:
- Followers / new followers: how many people subscribe to your social media updates, and how many of them are new each month.
- Likes, comment and post shares: how many times are people interacting with your posts in a meaningful way?
- Engagement rate: out of the number of times your posts were seen, how many times was it interacted with?
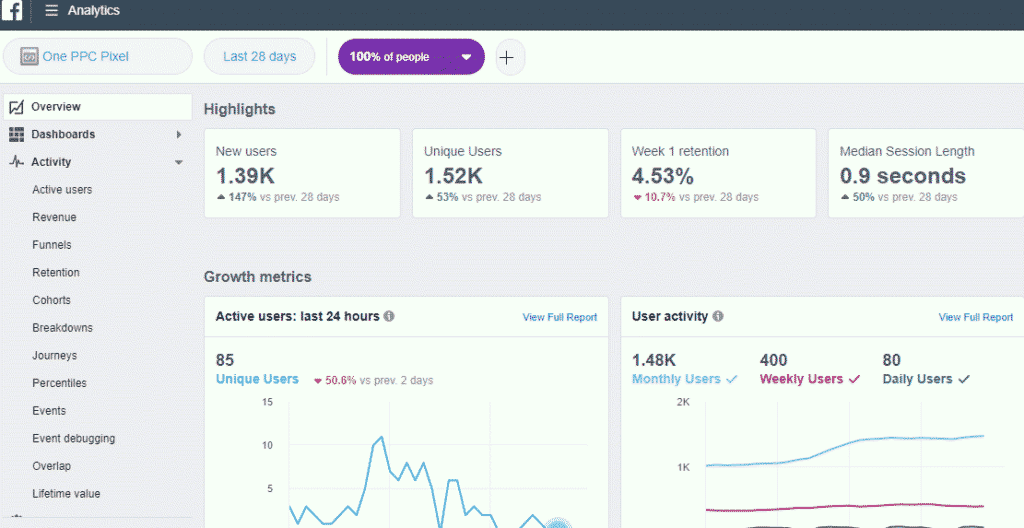
There are many more metrics that you can use to track your social media engagement, depending on how you use social media to meet your goals, all of which can be tracked using popular tools like Sprout Social, Hootsuite or Buffer, or tracked in the platform themselves. Here’s an example of what that looks like on Facebook, from One PPC:
SEO
Search engines are an incredibly powerful way to find new audiences. If someone is searching for a keyword relevant to the content you’ve created, chances are they’ll find it valuable. The practice of optimizing your content for search engines is called search engine optimization, or SEO. To measure your SEO efforts, you can use Google Analytics to measure ‘organic’ traffic.
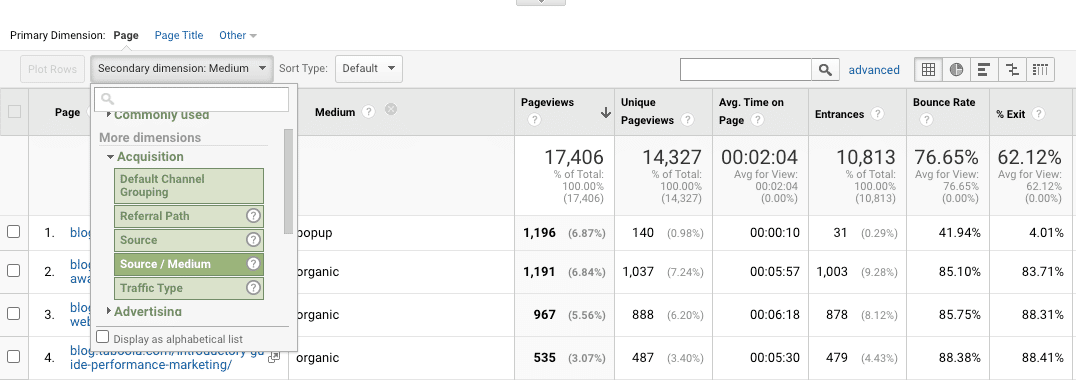
Use the same Google Analytics dashboard to narrow organic traffic by navigating to Behavior > Site Content > Medium to filter by only organic traffic.
Exposure and Authority
Often called ‘thought leadership,’ measuring your exposure and authority is the practice of finding metrics that determine how many people have heard of your brand, and how influential your brand is to them.
It’s the hardest metric to measure, but there are some quick ways to get started:
- Organic impressions: when people search for terms relevant to your business, do they see your content?
- PR coverage: how often is your company or executive team quoted or mentioned in the press?
- Industry events: how often are you asked to speak or attend industry events without paying?
- Sentiment: when people talk about your brand on social media or public forums, are they doing so with positive or negative sentiment?
When people start to recognize your brand as an authority on certain topics, whether online or in-person, you’ll know you’ve made an impact.
If you’re using paid promotional tactics to distribute your content, you can use a discovery platform like Taboola to track your results.
Some Final Thoughts
There are a number of metrics that you can use to track your content’s ROI, but it depends on your overall business goals.
To summarize:
- Determine which business goals your content marketing efforts will support, with a documented content marketing strategy
- Build a framework to measure your content’s impact on those goals
- Ultimately, you should strive to measure your content’s impact on sales and revenue, even if your efforts sit more towards the top of the funnel
You don’t need all of these metrics to successfully track your content marketing program, but make sure you’re tracking those that you’ve determined support your ultimate business goals outlined in your content strategy.