Synthetic monitoring is something that we all do. It’s almost something that you don’t think about. You set up a monitor and it just tells you if the service is up or down, most times with just a simple GET. There are the giants in this field (lately consolidated under the Keynote brand as part of AppDynamics) and the new comers like Catchpoint, ThousandEyes, Pingdom (now part of SolarWinds) and WorldPing. All solutions have the same basic concept, pull website information from different agents around the world and provide visibility for the web site operator on uptime, response times and other metrics. But what happens with you have a failure, and no alert?
These tools have become so widespread and have such long usage history, that it almost seems pointless to compare. This is a solved problem, no? Just take the cheapest one out there and you’re done. Here at Taboola Engineering, we decided to take a second look, as we had some glitches with our monitoring provider and as with every IT issue, you want to learn and improve to better the service for the next time. This is the journey we took to migrate off the big brands.
The story starts in mid 2015, I was on the train to meet friends after hours and got a call from the VP Marketing. “Is our web site down?” he asked me. My initial response was no, obviously not, how could it be? Not one alert fired, not one call from the NOC, and not one PagerDuty incident was created; surely the site must be up. But, as with all such calls, the easiest thing was to just browse the web site from my phone. Now at this point, you know the feeling, the train rattles on, the scenery around you blurs and field of vision narrows down to the small screen of the phone in front of you. And the phone screen stubbornly remains white. The website isn’t loading and with each second that ticks by you know the site is down, and the monitoring failed you. I brought back the phone to my ear and told the marketing exec, “yes, you’re right”, something is wrong, although I don’t know yet what that is. Time to dive deep and bring the site back. “Thanks for calling, I’m on it” was the closing line and the lead into the troubleshooting session.
My first move was to login to our monitoring service, one of the old respectable services. It was immediately clear that the site was down, and for more than a few hours. The fix was easy (the problem was with a bug in the landing page code, an easy roll back) and within 15 minutes the site was back online. But why didn’t I get any alert? Looking into the configuration of the monitoring system, it was not immediately clear what had gone wrong. The configuration is long, the GUI is very old and the system is sluggish at best, but hey, this is the de-facto industry standard for web monitoring. Eventually, with help from my team we found that the default configuration for alerting reads that most types of errors (DNS, connection timeout, error 500 and many many more) should send an alert, except one – “misc error”. It seems that the service took the failure to load a page and match text as a miscellaneous error, so that is the only alert that doesn’t get sent via email or API.
Missing the alert was the tipping point for our search in the path to find simpler and faster synthetic monitoring services. I am not saying in any way that missing the downtime is to be blamed on the monitoring service. We could have better engineered the system. Checking for lower boundary and not only top boundary alerts. Adding to that a simple one statistic of uptime and pulling it with an API call to a collection system or some internal observability system. But there is also something to be said for over engineering a solution. The simple fact is that we were looking to offload this task to an external provider, and we were now in the search for some solution that would be simple, fast, flexible, cater to a simple API, have a plugin or add-on community (or market) and above all would find incidents faster. At the time, worldPing were just at closed beta stage but it was clear that there is something different in this products approach. Simplicity, efficiency, full API integration, no compromise GUI.
The New Approach – Short Intervals
The first thing to notice is the very low interval of the testing cycle. We now had a service that can test our site and SaaS in 10 second intervals. The ability to get 20 agents pulling every 10 seconds provides many data points and the ability to alert on them very fast. At the basic level, if you wish to wait for 3 agents to fail 3 times for an alert, you need only wait for 30 seconds. For services that wish to be highly available shortening the time of alerting is an important place to shave off valuable time in the MTTR. (obviously it is best to be proactive and resolve issues before they develop to downtime). This also allows for fast updates when issues are resolved. When running a troubleshooting session and you want to see if a change worked, or at least made a difference, there is very little time to wait, as the metrics come in fast and the system can display them in good timing.
Test interval of 10 seconds per agent:
The New Approach – Easy API Access
Next is the API access. As we already have our solution for dashboards (Grafana) there was little to no work for integration, but nonetheless, pulling stats from the service is easy. Providing a good source of information for multiple internal clients to view the status of the website or service was a great win. Other integrations for automatic alerting directly for the person on call was the next logical phase. Bringing issues to the attention of the on-duty engineer further helps reduce MTTR. So the fact the alert comes in fast is the first piece, and reaching the right person is the second.
Testing the Product
For the next 7 months we tested the solutions neck to neck, alerts were sent in parallel, both systems updated with the new endpoints to be monitored. It was clear from the first alert that one system is fast and the other is not. No false alarms were sent, no real event missed. But changing synthetic monitoring systems is something that one doesn’t take lightly. We have been using the legacy system for many years, and personally I have been using them for over a decade. When the renewal for the legacy system came in, it was clear that this would not happen. We have not logged into the system in months and have moved all our troubleshooting sessions and visibility to the new system (worldPing).
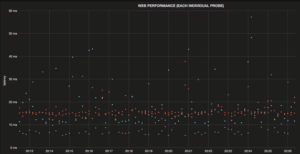
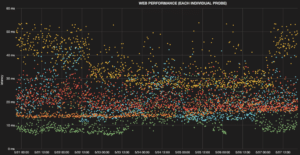
One specific feature stood out – Scatter Plot. While line graphs are all nice and pleasing on the eye, there is a lot of information missing. The more data you have, the harder it is to render the scatter plot and some of the providers put a cap on the data allowed in the graph (truncating it or right down denying access to more than 5 days). With WorldPing we found the response time of the scatter plot pleasing and the ability to customize any report, and the scatter plot among them a power data visualization tool.
15 minute graph:
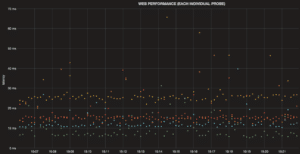
24 hour graph:
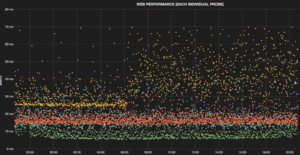
7 day graph:
We now have a fast responding SaaS provider with coverage for all the features we were looking for:
- Fast test intervals on multiple regions of agents
- The ability to add private agents and add to the data set our own measurements (internal or external)
- Main HTTP protocol path covered (network connectivity, DNS lookup, HTTP and HTTPS)
- Keyword search in the results
- Custom header for the agent, to filter out in the logs
- Fast alerting
While you might want additional “full browser” tests for some cases, for our business this was more than enough. The flexibility of the solution with the ease of use and speedy setup allowed answered most of what we needed. With the team working in Grafana on a daily basis the actual use of the tool was much higher, as you now have the same user interface as Grafana. The legacy solutions were measured and found wanting. No more high pricing for synthetic solutions that when we had a downtime didn’t alert. No more solutions that take 5 min to send off the alert for of an issue. Now I know of issues way before I get the call, most times, I know of them before they become a major issue.