Have you ever tried building an infrastructure to upload 150TB a day? Have you ever tried querying over 13PB without going bankrupt?
These are some of Taboola’s PV2Google (pageviews to Google) service scale challenges that we deal with in our day to day.
In this blog series, we’ll share how we do it, and the challenges we face. In this article (part 1) we’ll focus on the architecture. Part 2 covers the lessons we’ve learned over the years.
Hello, Pageviews!
Taboola’s goal is to power recommendations for publishers and advertisers. Our platform serves over 360 billion content recommendations and processes over two billion pageviews a day. Pageview is a record describing recommendations, user activity (such as a click), and much more on a user’s visit to a webpage. Currently, the pageview record has about 1,000 fields.
Two billion pageviews generate a huge amount of data. This data is processed and analyzed using Apache Spark clusters, which have ~25K (on-prem) cores. On-prem processing works great for periodic analysis, such as billing. However, our analysts and development teams perform complex interactive queries on long-term data. These ad-hoc queries create peak demand for resources we don’t have. This is where Google’s BigQuery cloud service comes in.
BigQuery is a highly scalable and high-performance database service. It lets you run queries over huge amounts of data (PBs) in a short amount of time. For example, BigQuery enables us to run queries on a month or more of pageviews in a matter of minutes. Furthermore, it enables us to store six months of pageviews, over 13PB. Obviously, this is not free of charge. BigQuery’s pricing model is by data storage and per query (the scanned bytes).
PV2Google is a Taboola service responsible for building and uploading pageviews to BigQuery, over 2 billion pageviews per day. It builds the pageviews at our own data-center and then uploads them to Google cloud, about 150TB/day.
At high level, the PV2Google service can be divided into three parts:
- Data path – handles the data processing and the data relay
- Control path – schedules the data path operations
- Monitoring path – exposes the service status and alerts when things go bad
The Data Path
PV2Google’s data path handles the data processing and the data relay. This process is composed of three steps:
- Building the pageviews and uploading them to Google Cloud Storage using Spark
- Loading the pageviews from Google Cloud Storage to a stage table in BigQuery
- Copying the stage table to a production table
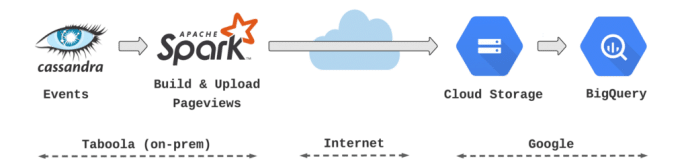
Figure 1. PV2Google’s data path
The first step, building and uploading the pageviews, is a heavy and complex data-processing step. This step has to be parallelised and executed over hundreds of cores. We chose Apache Spark to do so.
Each Spark task is responsible for processing about 1/3000 of the data. Each task reads the relevant events from Apache Cassandra datastore, builds its pageviews in memory, and uploads them to Google Cloud Storage as one (newline delimited) JSON file. The newline-delimited-JSON file format supports nested data structures, a key requirement to represent a pageview. Each page view is a line in that file. Lastly, the pageviews BigQuery’s schema is automatically generated based on the Java classes.
At the second step we load the JSON files to a stage table in BigQuery. The stage table enables us to validate the loaded data before using it in production. This is a simple PV2Google step. All it does is submit a few load jobs to BigQuery. BigQuery does all the data heavy lifting.
The last step is to append the stage table to the production table. BigQuery’s copy job is used to append the data. Appending the data is an atomic operation, ensuring that the production table’s data is always consistent.
The above functionalities are implemented by a Java microservice named PV2Google engine. It is responsible for building the pageviews, uploading them, and controlling BigQuery jobs. The engine features a REST API to trigger and monitor its functions.
The Control Path
The control path schedules the data path operations. Every hour, PV2Google uploads an hour of pageviews data to BigQuery by executing the three data path steps described above. To do so, we better have a good control plane!
We chose Apache Airflow for the control plane. Airflow is an open source platform used to schedule and monitor workflows. Each workflow is described by a DAG (Direct Acyclic Graph). Airflow schedules the DAGs to run periodically based on its cron configuration. The DAGs’ nodes represent operators. Each operator is a single task required to complete the workflow. Airflow manages the executions of its operators: ordering them, running them, retrying and monitoring them.
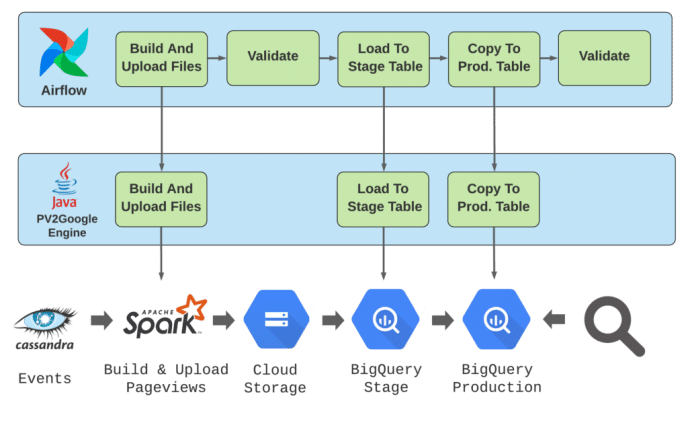
Figure 2. Airflow and PV2Google control path
PV2Google data path workflow is described by a DAG, which is composed of two operator classes:
- Data path operators: execute PV2Google engine jobs. The operator submits an engine job and polls it’s status until it completes using the engine’s REST API.
- Validation operators: protect the process from invalid data. The operator queries the status and production tables to validate the uploaded data: row count, byte count and average record size. When a severe anomaly is detected, the operator would fail and halt the DAG execution.
The Monitoring Path
PV2Google users expect complete and timely pageviews at BigQuery. Most of the time, the process does that well. But, once in a while, things might go wrong: network issues might fail uploads, databases might be unavailable, Google might have temporary issues, and other unexpected problems might occur. Hence, good monitoring is a key part for the service availability and performance.

Figure 3. PV2Google’s monitoring path
PV2Google monitoring is composed of two parts:
- Alerts: although we have retry mechanisms, some problems might require human intervention. A variety of checks detect such cases and call for human help using Pagerduty.
- Visibility: visibility exposes us to a variety of metrics on the current and historical state of the service. In case of an anomaly, comparing the current and historical data is essential for troubleshooting the problem. In addition, the historical data exposes the service performance trends. This enables us to further optimize the service (e.g. add resources due to data growth).
Every two minutes we query Airflow and PV2Google’s state databases looking for anomalies like a failed DAG run, or an operator that’s running for too long.
There are two types of anomalies:
- Alerts: triggered when things go wrong and human intervention is required. An alert creates a Pagerduty incident and sends a Slack notification. For example, a DAG run has failed or table row count is significantly low/high.
- Warnings: warnings have lower thresholds than alerts. They warn us when the service is getting close to the edge and an alert might happen. A warning sends only a Slack notification. For example, DAG is taking too long and about to reach timeout or table row count is outside the expected range.
For each operation we keep metrics and statuses in MySQL state tables. These metrics are kept for a long period of time.
Grafana is a great tool to expose time-series data as graphs. We created various graphs showing:
- DAGs and operators duration, retries count and state
- BigQuery production tables metrics such as row, byte and average record size
- Performance of DAGs, operators and engine jobs. For example, bytes upload rate
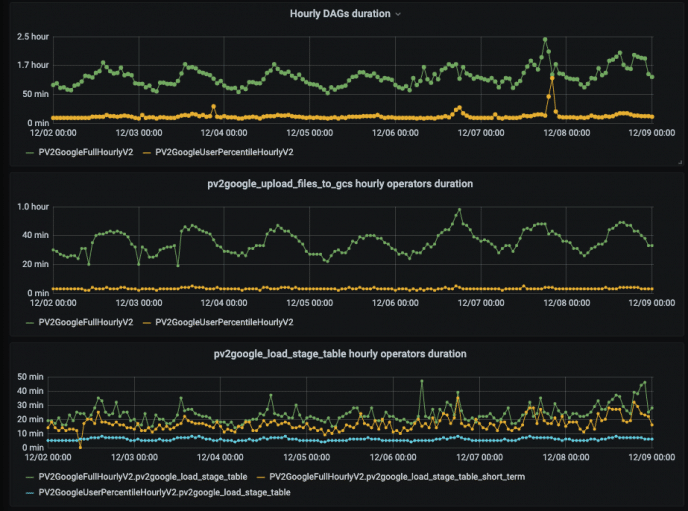
Figure 4. Top: DAG duration, middle: build and upload files operator duration, bottom: load to stage table operator duration
150TB/day is complicated
Building and operating a service that uploads over 150TB/day is a complex task. At this scale, the right architecture is important. Decomposing the service into a few paths, as demonstrated above, is a key to the service success.
In part 2, we will share the lessons we learned from operating PV2Google service over the years, how to reduce cost, increase reliability, …