Advertisers and publishers run content recommendation campaigns, or discovery campaigns, across all industries in the United States (US), but what determines their success is what people actually end up finding, and eventually reading.
At the end of 2016, we took a look at the different spend categories in the US, and discovered that across all platforms—desktop, mobile, tablet and any others—entertainment and finance were the dominant average US content categories clicked.
How US users clicked while they were on-the-go

As mobile usage grows from big to bigger, more businesses are targeting readers on their cell-phones, tablets and other mobile devices.
In the following graphs, you’ll see bars which represent the percentage of revenue spent on a content category by advertisers, and round marks indicating the click-through-rate (CTR) for that respective category. The “x” axis shows the categories we explored. The left “y” axis shows the percentage spent, while the right “y” axis shows the average CTR.
The CTRs vary widely depending on the attractiveness of campaign items (items are a combination of a picture and text). The numbers below are the average of this very wide spectrum.
In 2016, mobile readers clicked more heavily in the entertainment category than any other, which is also the highest spend category, with a “spent percentage” of 19 percent.
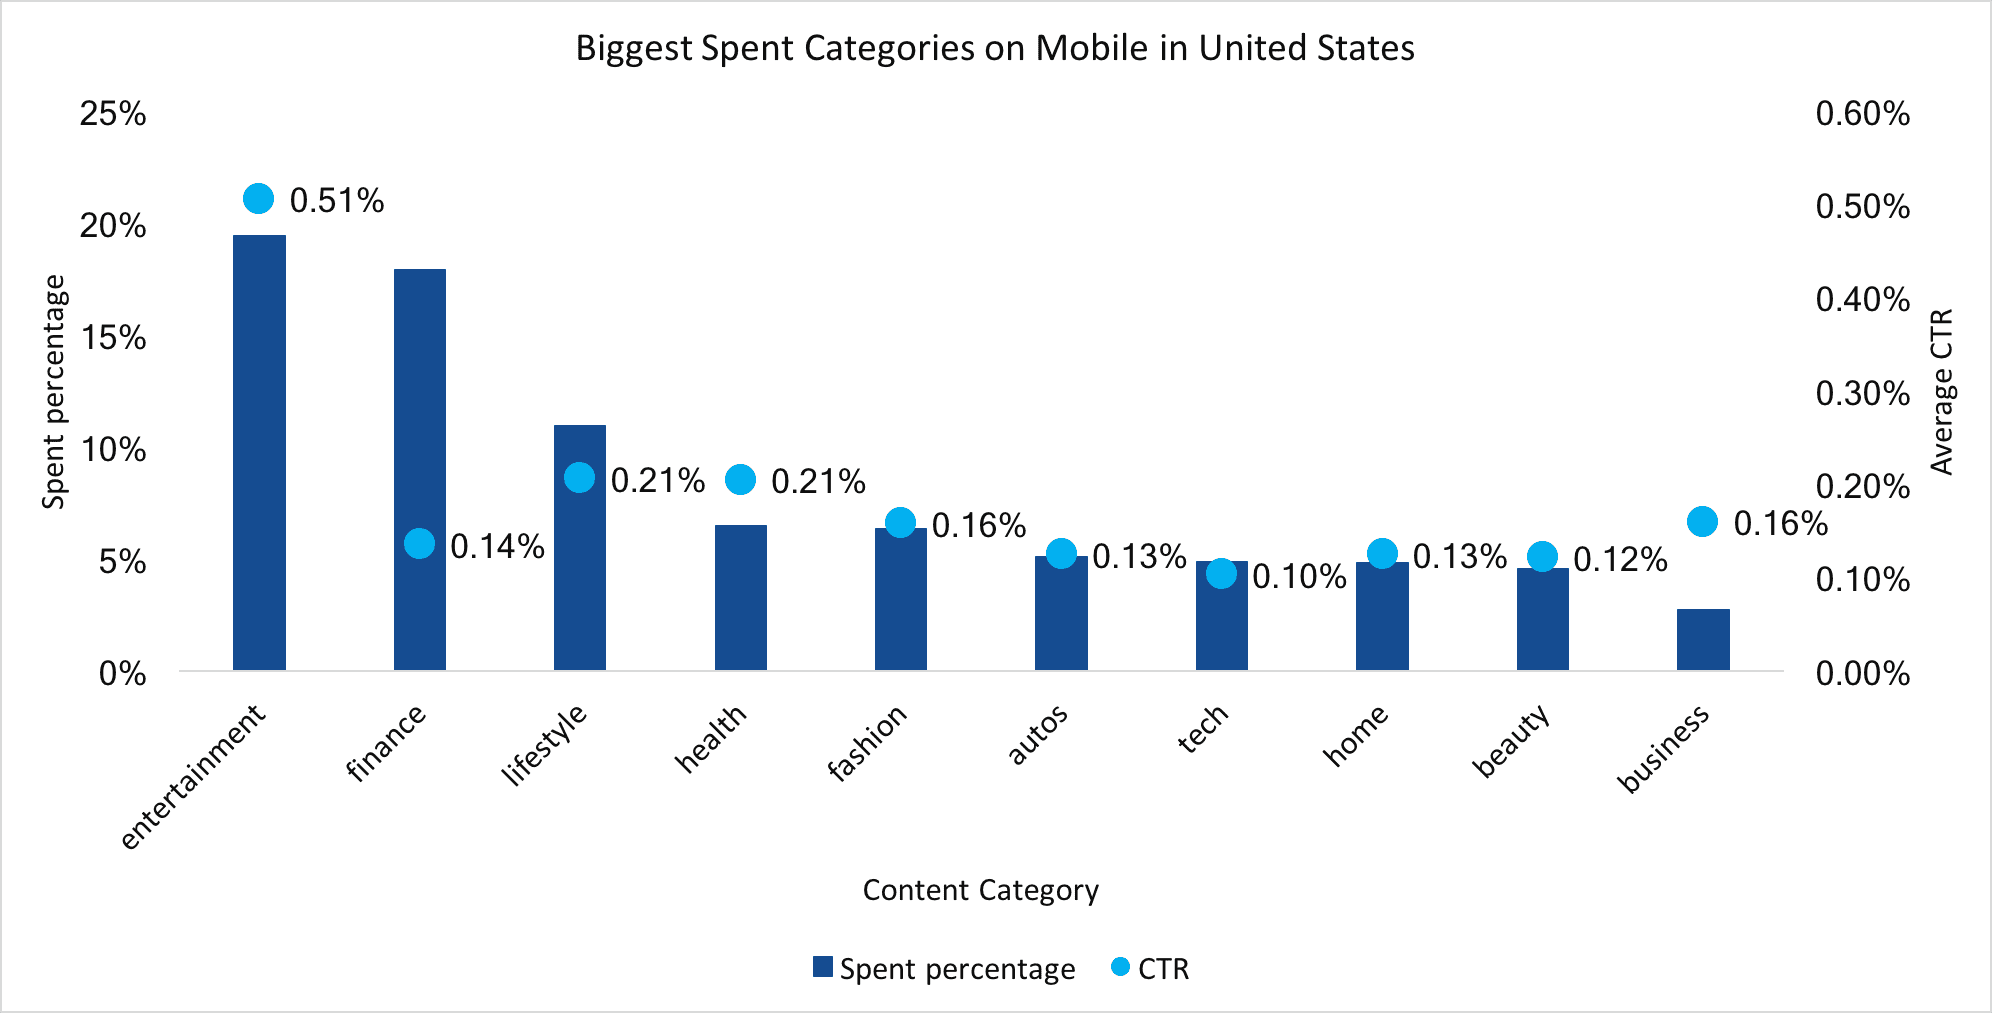
The finance and lifestyle spend categories followed closely after entertainment, while the rest—health, fashion, auto, technology, home, beauty and business—all hovered closely between the 5 and 10 percent line.
Tablet users were targeted similarly, but on average, US content categories lifestyle and health achieved a much higher “spent percentage” than on mobile, even though more was spent in the finance category. The CTRs of all categories were higher for tablets than on mobile devices.
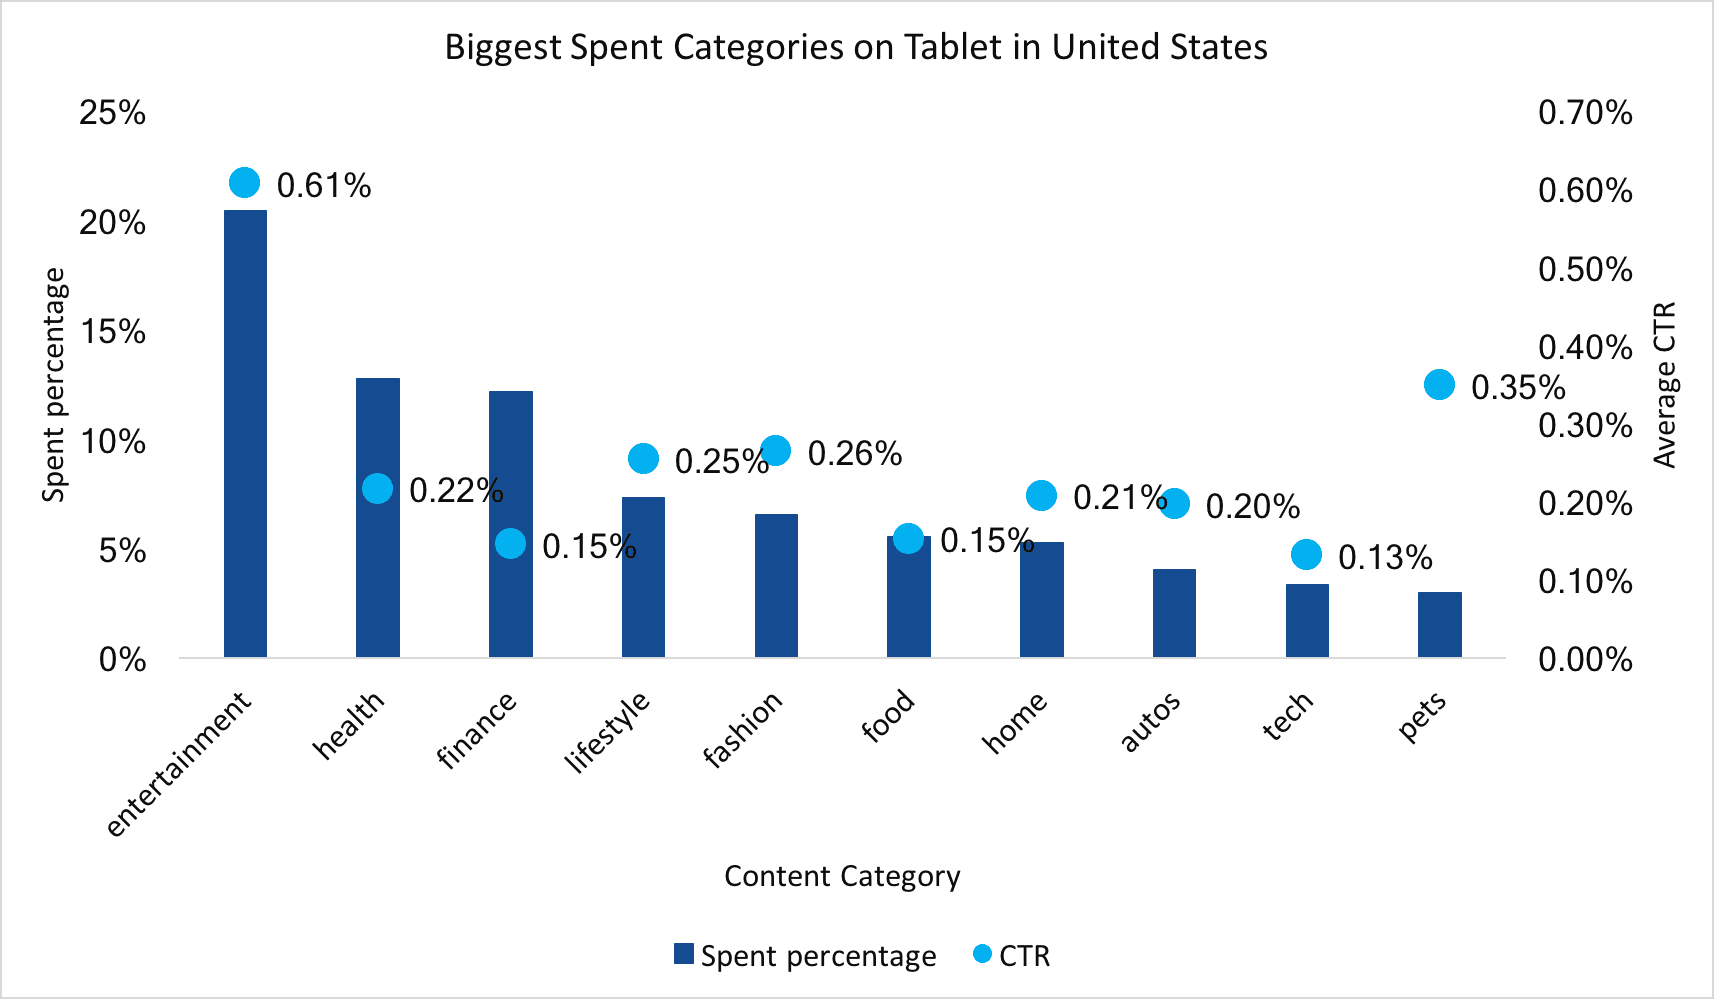
Most surprisingly, the pets category had a .35 percentage average CTR, second only to entertainment with .61 percent CTR.
How US readers clicked on their desktops

While mobile continues its climb to the top as the most desirable advertising platform, advertisers do still allocate a significant percentage of their spend to desktop content recommendation campaigns, and to readers on other devices.
For desktop readers, the entertainment category CTR was still the highest in 2016, with finance and health categories falling close behind.
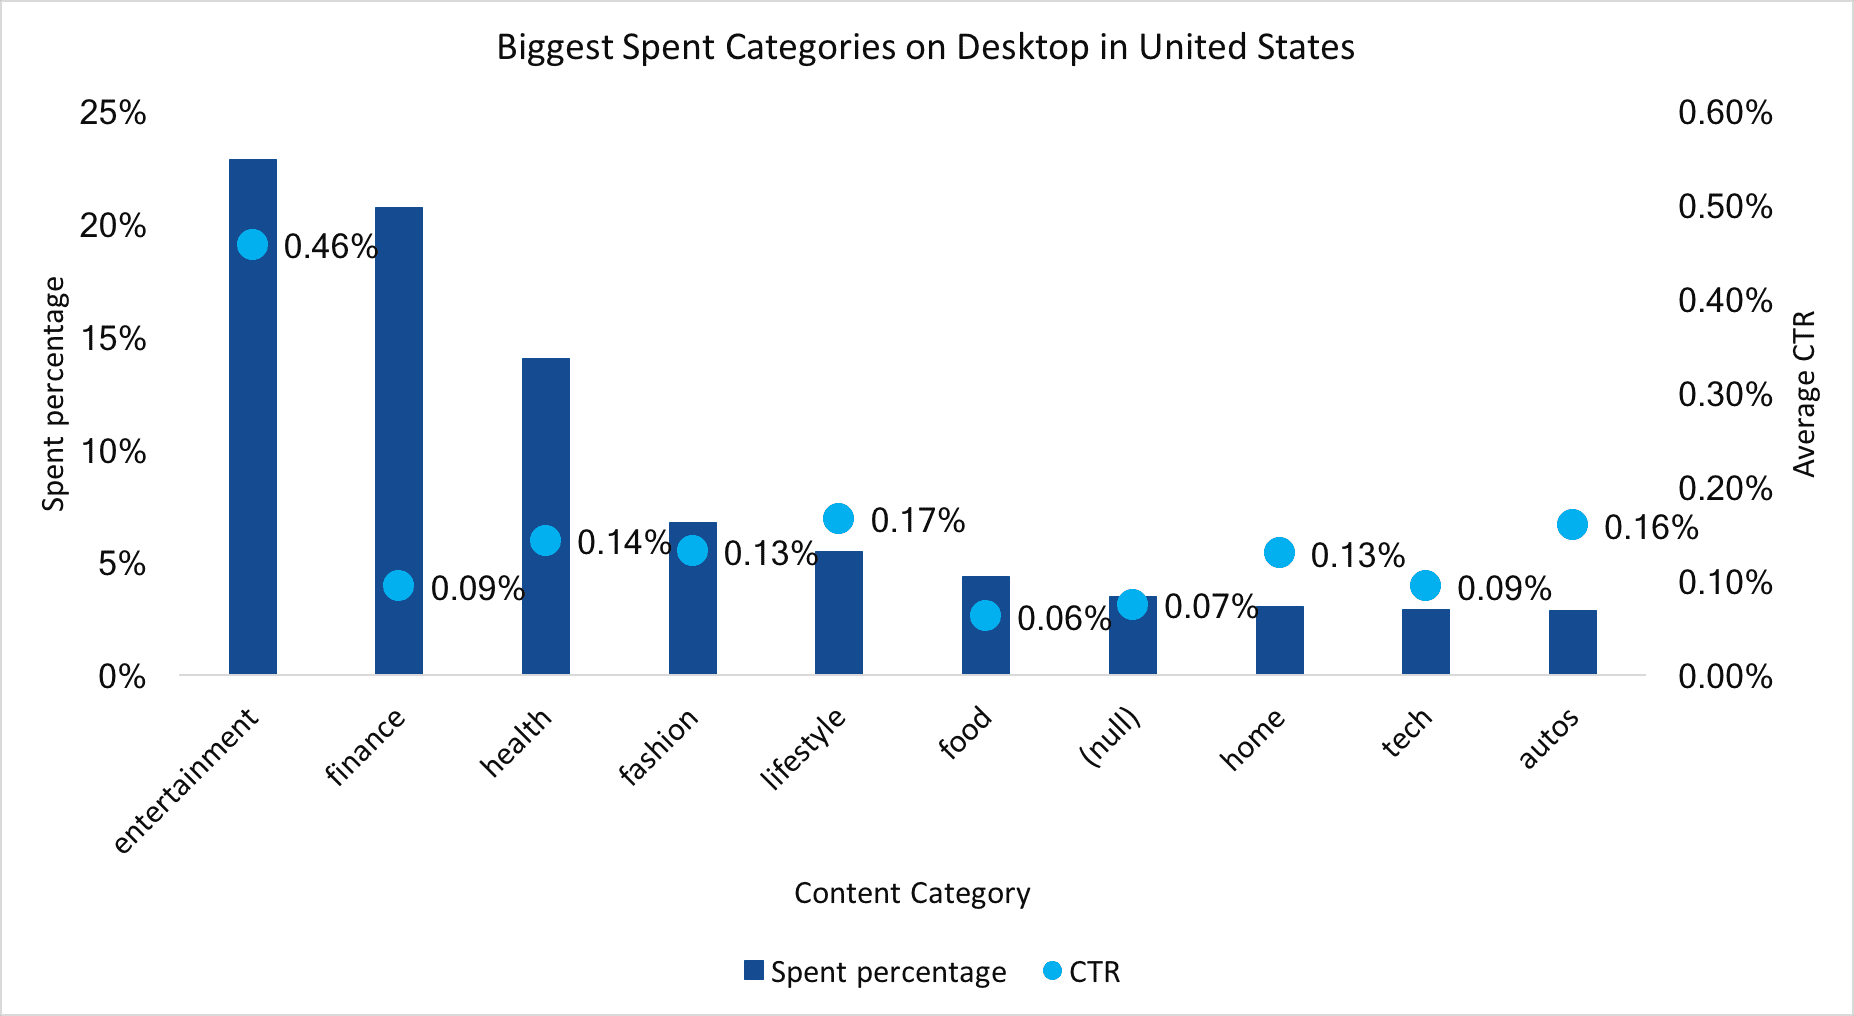
The secondary CTRs of finance and health are interesting, as the average spend percentage is lower than the CTR for finance recommendation campaigns.
For all other platforms, entertainment, finance and health were still the categories with the highest numbers of clicks in 2016.
The bottom line—advertisers spend more in the entertainment and finance categories than any other. The average US content categories clicked align with spend. Regardless of their content goals, advertisers from any category can find more success in their content discovery campaigns by optimizing content, targeting strategy and media placement.
Taboola is the world’s leading content discovery platform, serving 360B recommendations to over 1B unique visitors each month on the web’s most innovative publisher sites. To find out how we can support your next discovery campaign, contact us or start your campaign now.